Introduction
CATMA is a web application for text annotation, analysis and visualization. It is specifically designed to emulate the flexible workflows of hermeneutic text interpretation.
This Compact Manual will briefly guide you through CATMA to show you its basic components and functions. For more detailed, step-by-step instructions on the process of creating annotations as well as analysis and visualizations, please visit our Tutorials. If you are unsure about the meaning of a particular term, have a look at the Glossary.
Let’s get started!
Start Screen
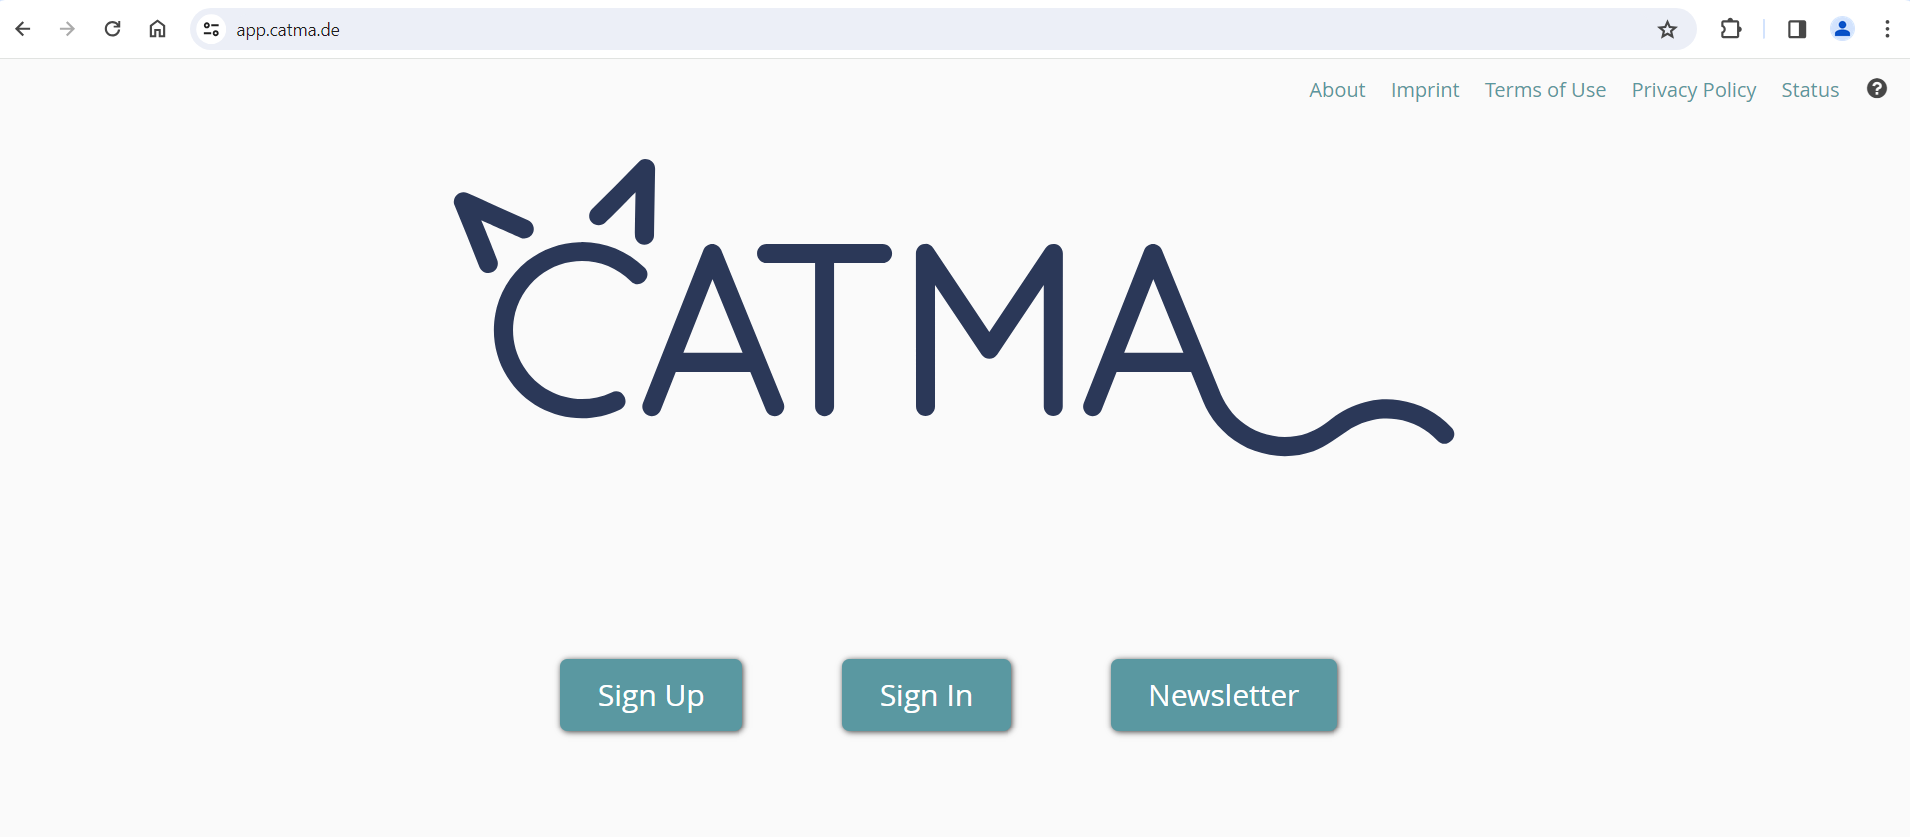
The start screen is the first thing that you see when you visit the CATMA web application at https://app.catma.de
Sign Up
Click “Sign Up” if you have never worked with CATMA before and would like to set up a new CATMA account – this only takes a minute!
Sign In
If you already have an account, click “Sign In“.
Newsletter
Would you like to be notified about new CATMA features, workshops, and other CATMA news? Subscribe to our Newsletter by clicking the button!
Additional Information
Additional information about CATMA can be found under the various links at the top right of the start screen.
Dashboard
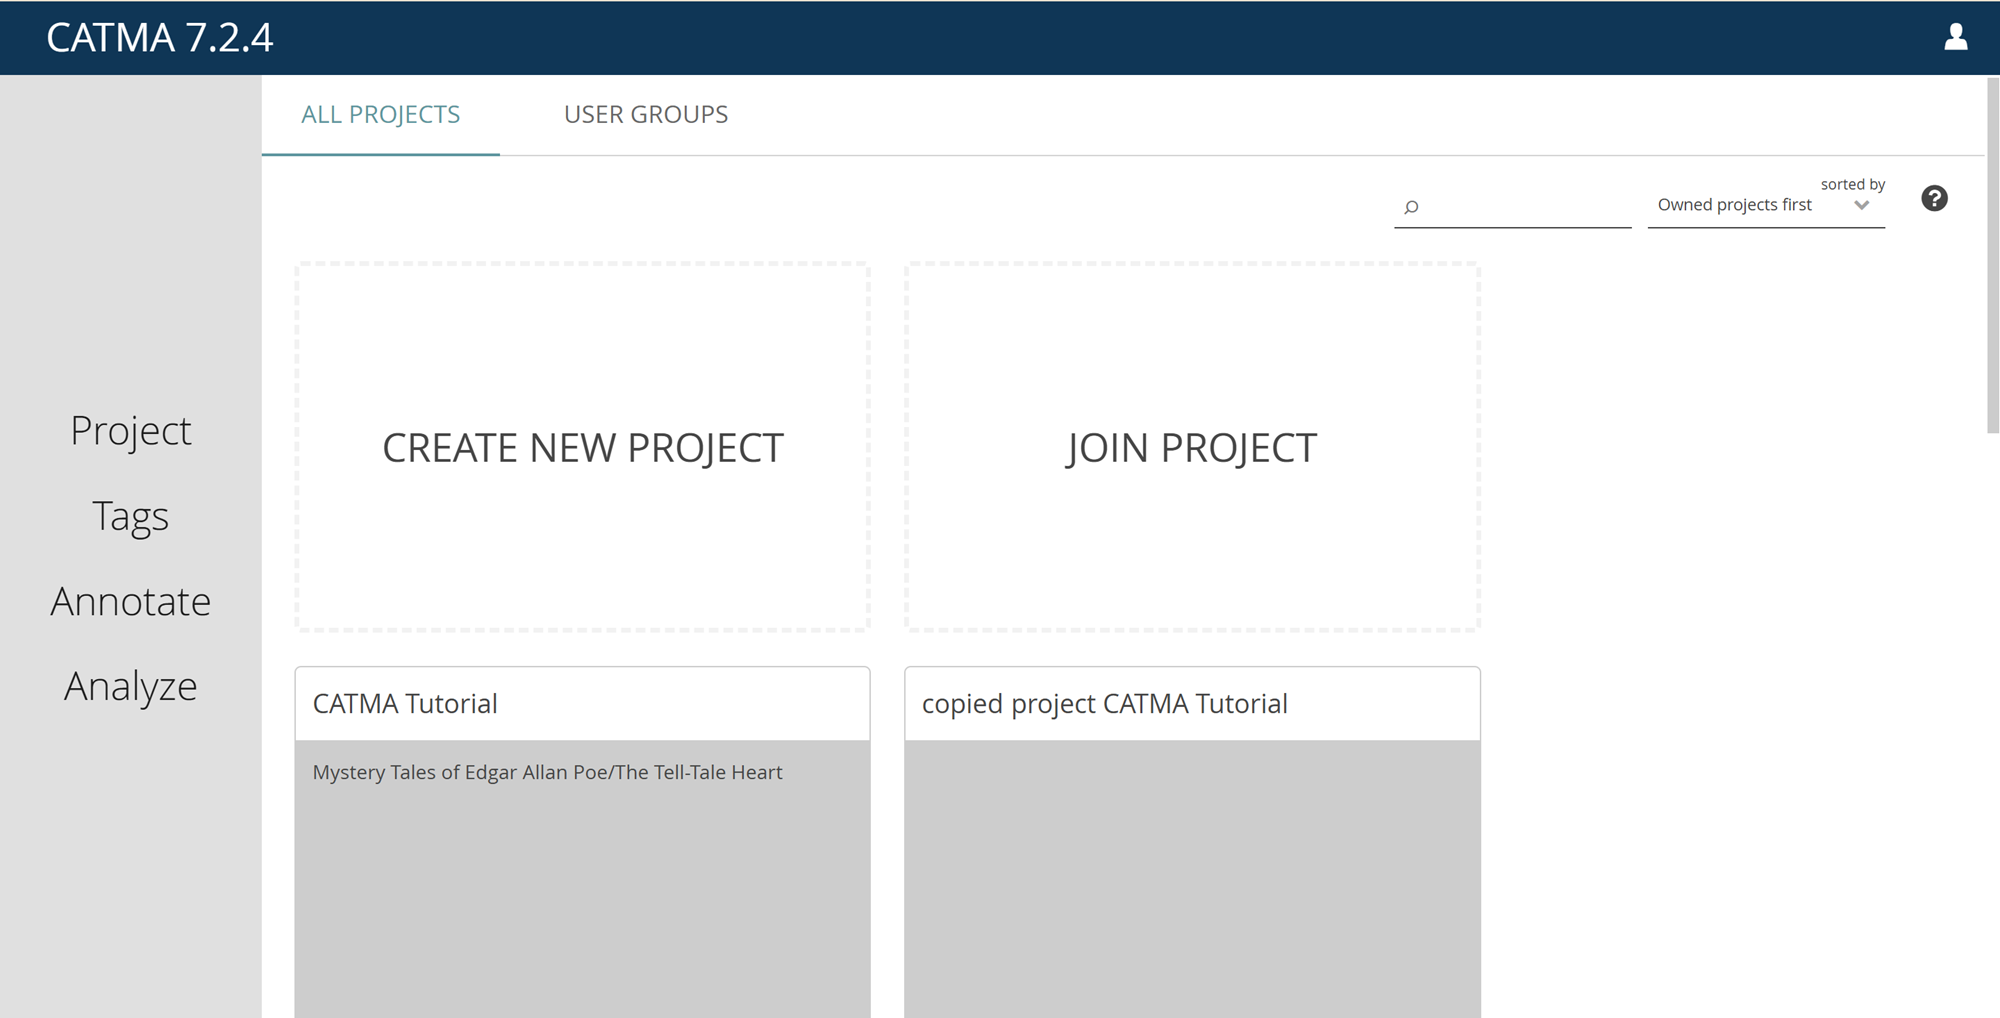
The dashboard is the first thing that you see after logging in to CATMA. At the top there are two tabs: one to view and manage Projects, and one to view and manage User Groups.
Each tab has common controls in the upper-right corner, allowing you to search and to change the sort order of the displayed tiles.
Tiles with a dashed border are special placeholders that act like menu options. Click on these to perform the indicated function, such as to create a new project or user group.
Modules and Side Menu
On the left side of the dashboard you’ll find a menu listing the CATMA modules Project, Tags, Annotate and Analyze. These menu items are not yet clickable when on the dashboard. To be able to navigate through the different CATMA modules via the menu, you have to open a project first – just click the relevant project tile.
Projects
All work in CATMA is organized into projects. In a project you upload your texts (Documents), create or upload Tagsets and Annotation Collections, and manage project Members and their Roles.
Create Project
Once logged in, you’ll see your CATMA dashboard with a tiled overview of the projects you’re a member of. If you’re new to CATMA, there will be no actual project tiles yet and you’ll only see the placeholder tiles. So let’s get started:
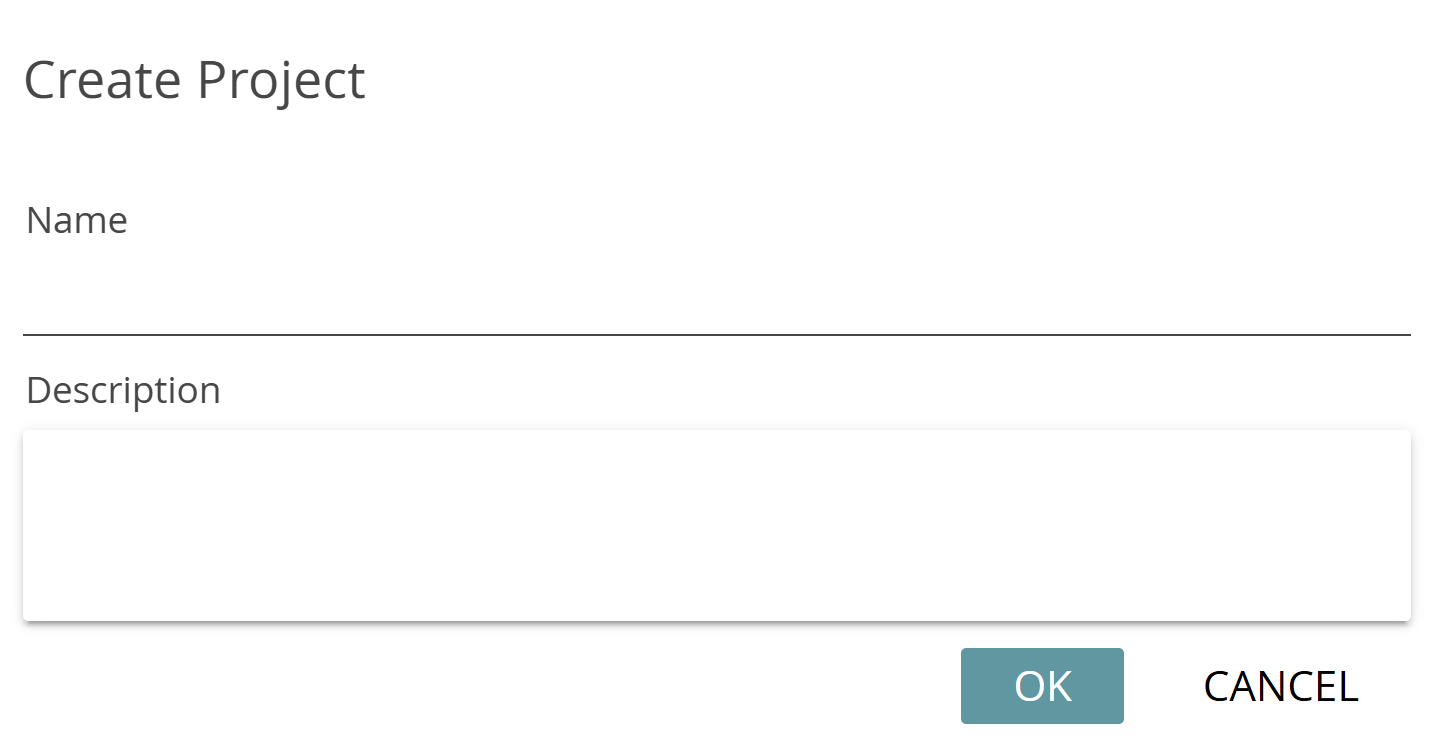
Create your first CATMA project by clicking the “Create New Project” tile. Just type in a name and, if you like, a description of your project, confirm and you’re done: you are now the proud owner of a CATMA project, which is shown as a tile on your dashboard. If you want to delete a project, click the bin icon on the tile – if you want to edit the name or description, click the pencil icon. Deleting and editing a project is only possible if your role allows it.
Join Project
Generally speaking, other users will invite you to their projects via email and you can simply click on a link to join. The “Join Project” placeholder tile, on the other hand, is part of a special workflow that allows project owners to add members to their project in bulk and in ‘real time’. See Typical Seminar Workflow for details on how this works.
User Groups
User groups are a way to manage large collections of users and easily share projects with them. Their use is entirely optional, but can save a lot of time in certain scenarios.
Create New User Group
To create a user group, switch to the “User Groups” tab, then click on the “Create New User Group” tile. Enter the name of the user group and optionally a description, then confirm. The new group will appear as a tile.
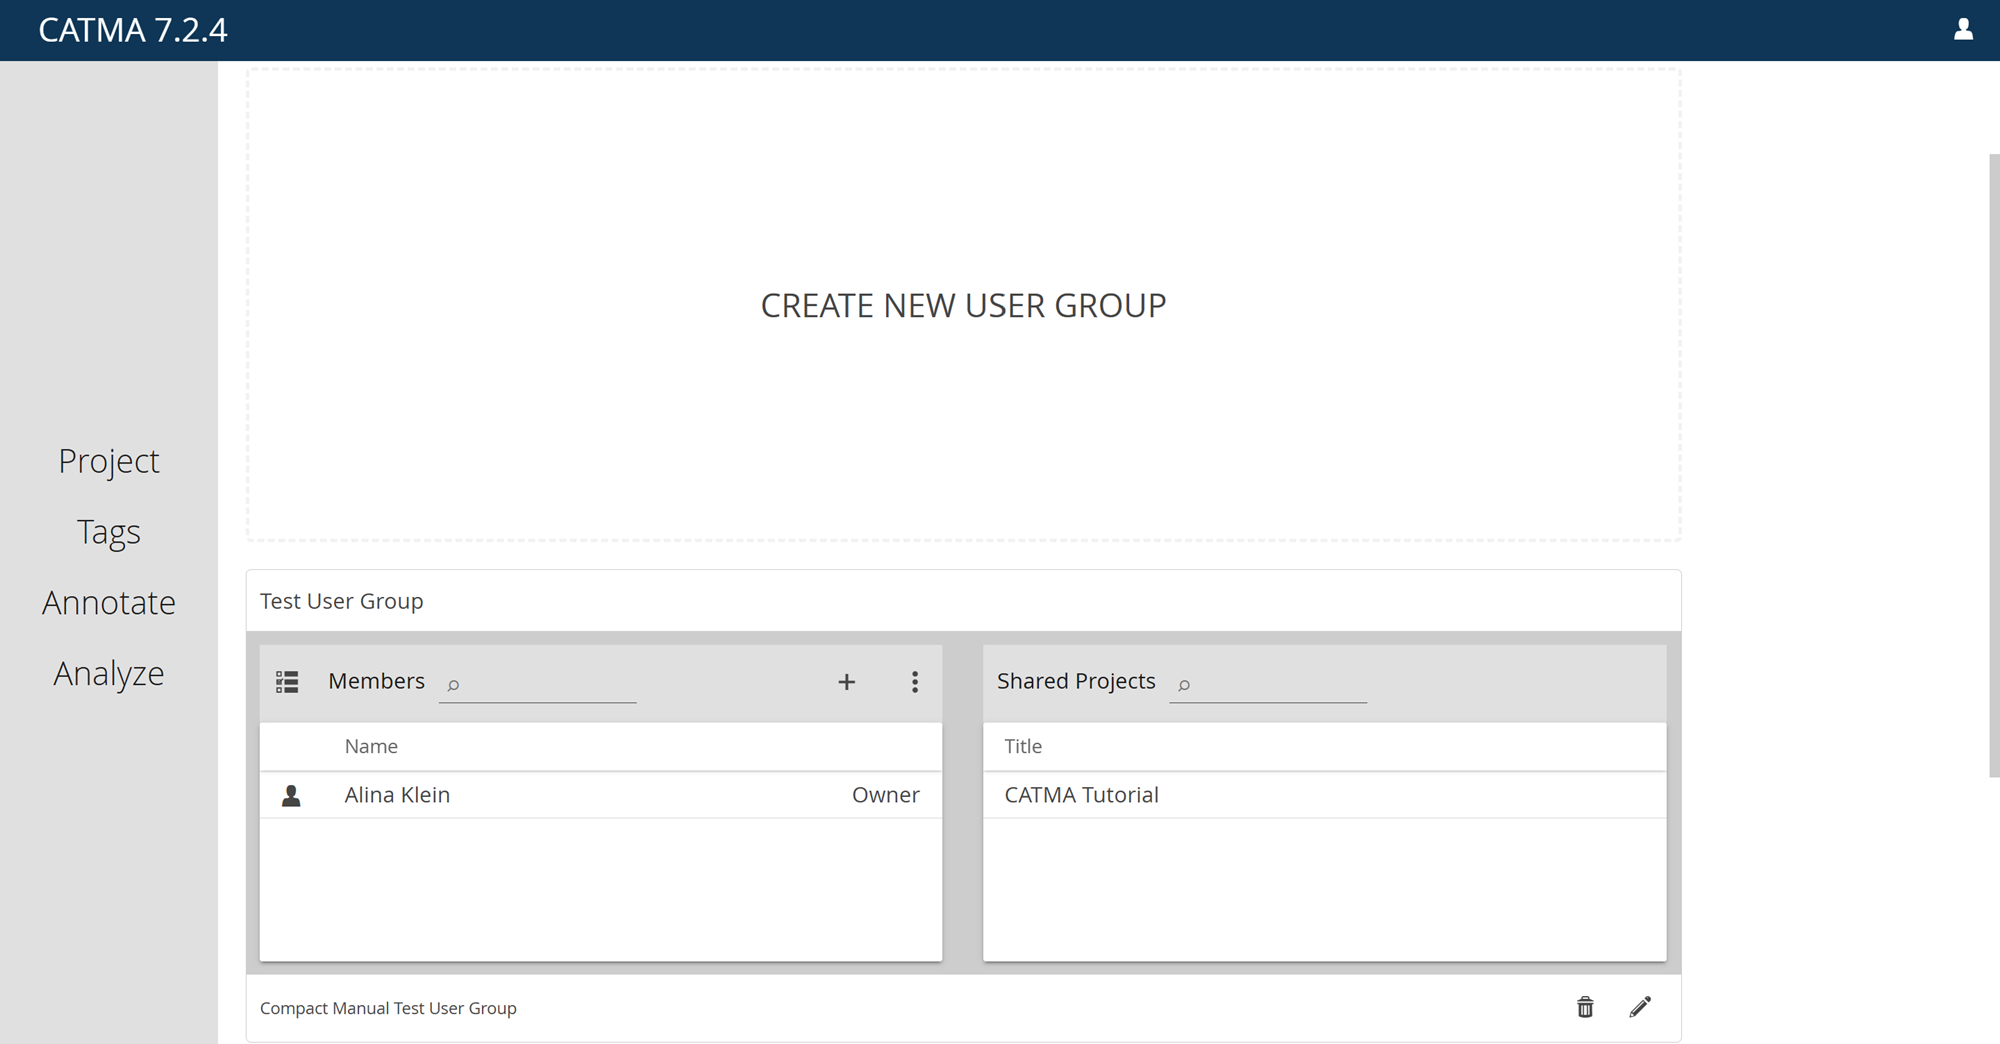
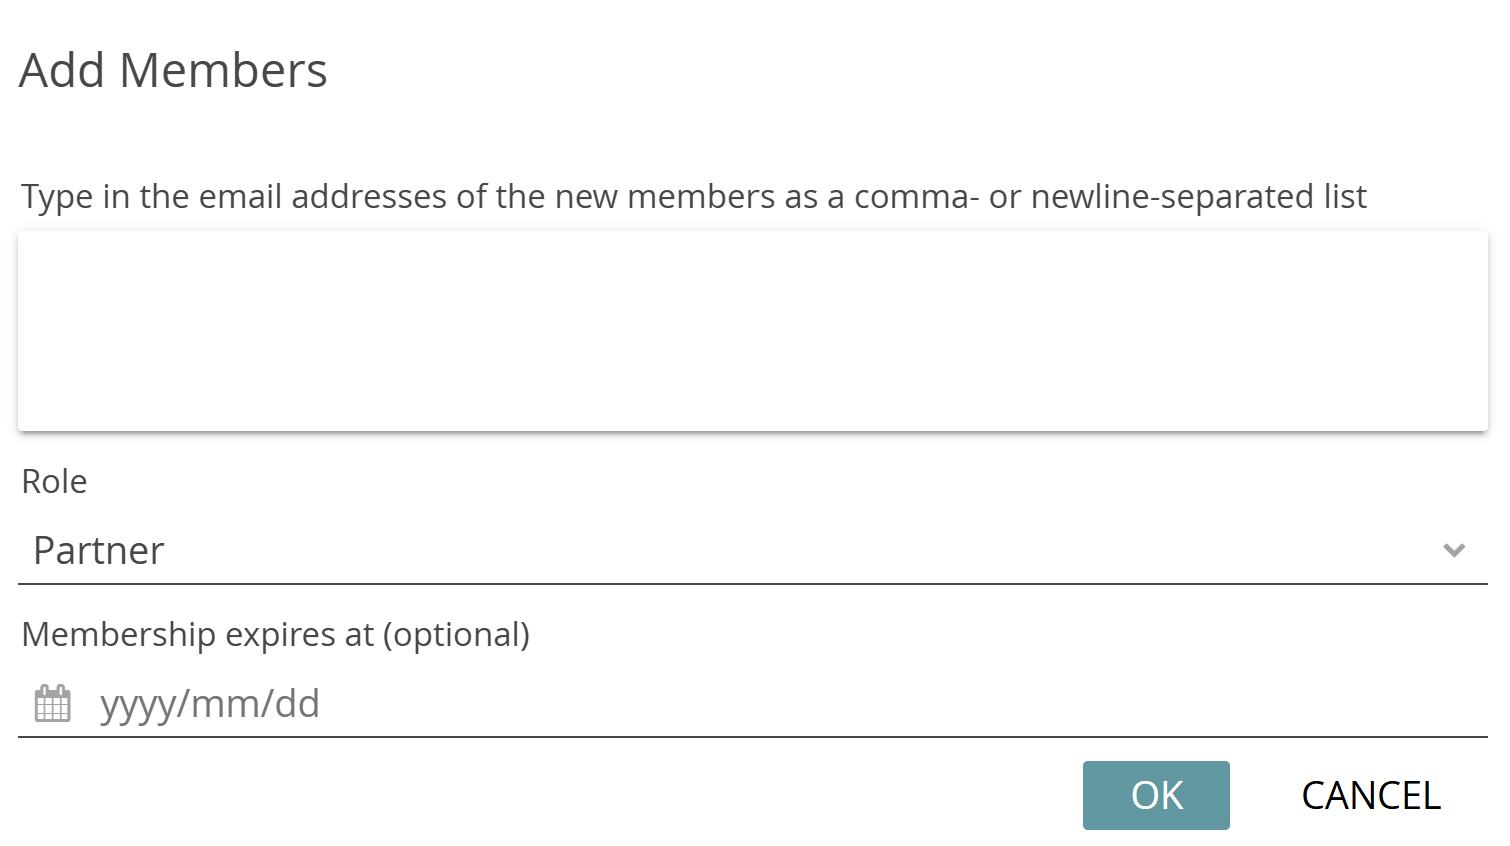
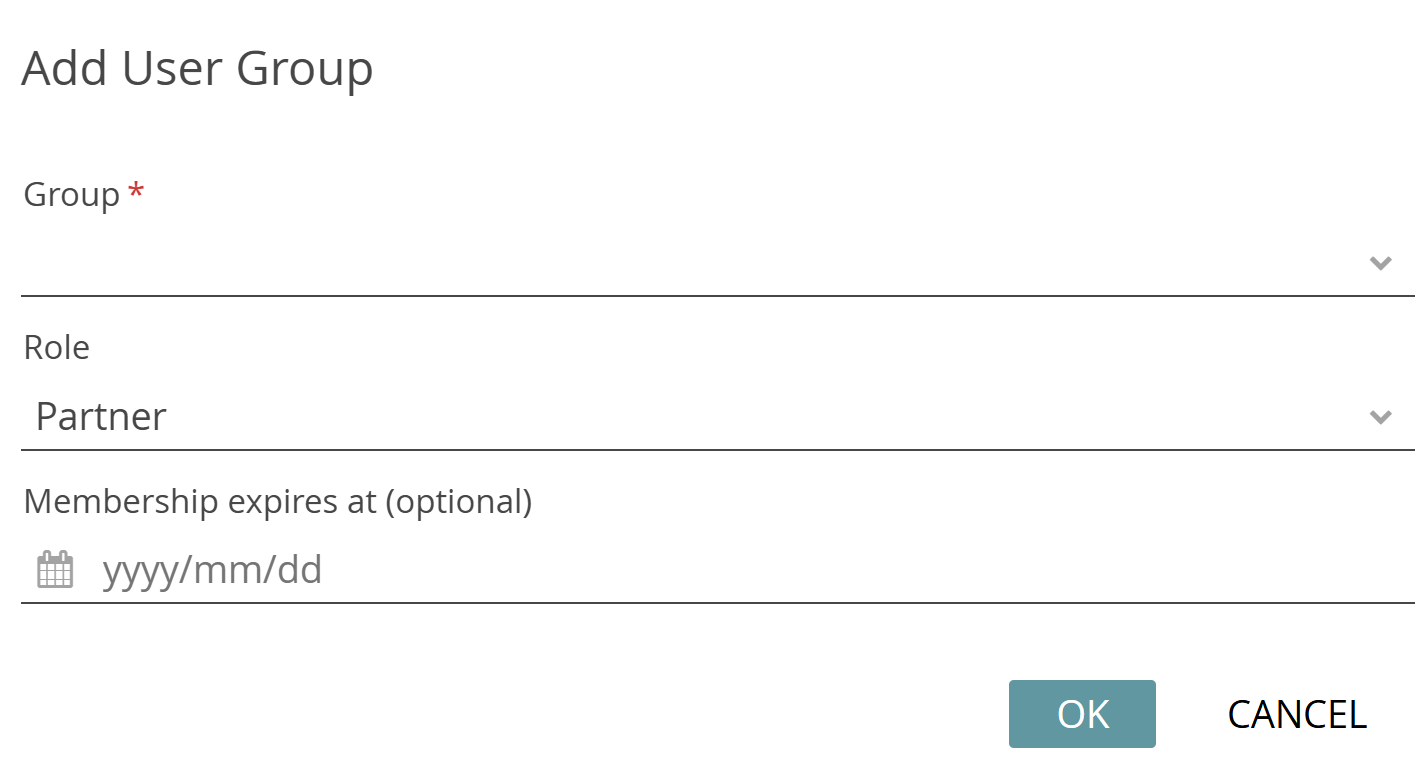
The next step is to add members to your user group by clicking on the plus icon at the top right of the Members panel within the group tile. Enter the email addresses of the people you want to invite and select their role in the group from the drop-down menu. All invited persons are assigned the same role. Optionally, you can also enter a date on which the invitees’ group membership will expire.
If you want to delete a user group, click the bin icon on the tile – if you want to edit the name or description, click the pencil icon. Deleting and editing a user group is only possible if your role allows it.
Sharing projects with user groups is done from the project side (see Members below).
Project Module
Enter the Project Module
On entering the Project module by selecting a project on the dashboard, the side menu on the left becomes active and the Project module button is highlighted. The name of the open project is displayed centrally in the title bar at the top of the screen. It is now possible to switch between the different CATMA modules using the side menu. If you want to return to the dashboard and select a different project, just click on the home icon or “CATMA 7.x.x” text at the left of the title bar. You don’t need to worry about saving your changes before closing a project in this way – that happens automatically.
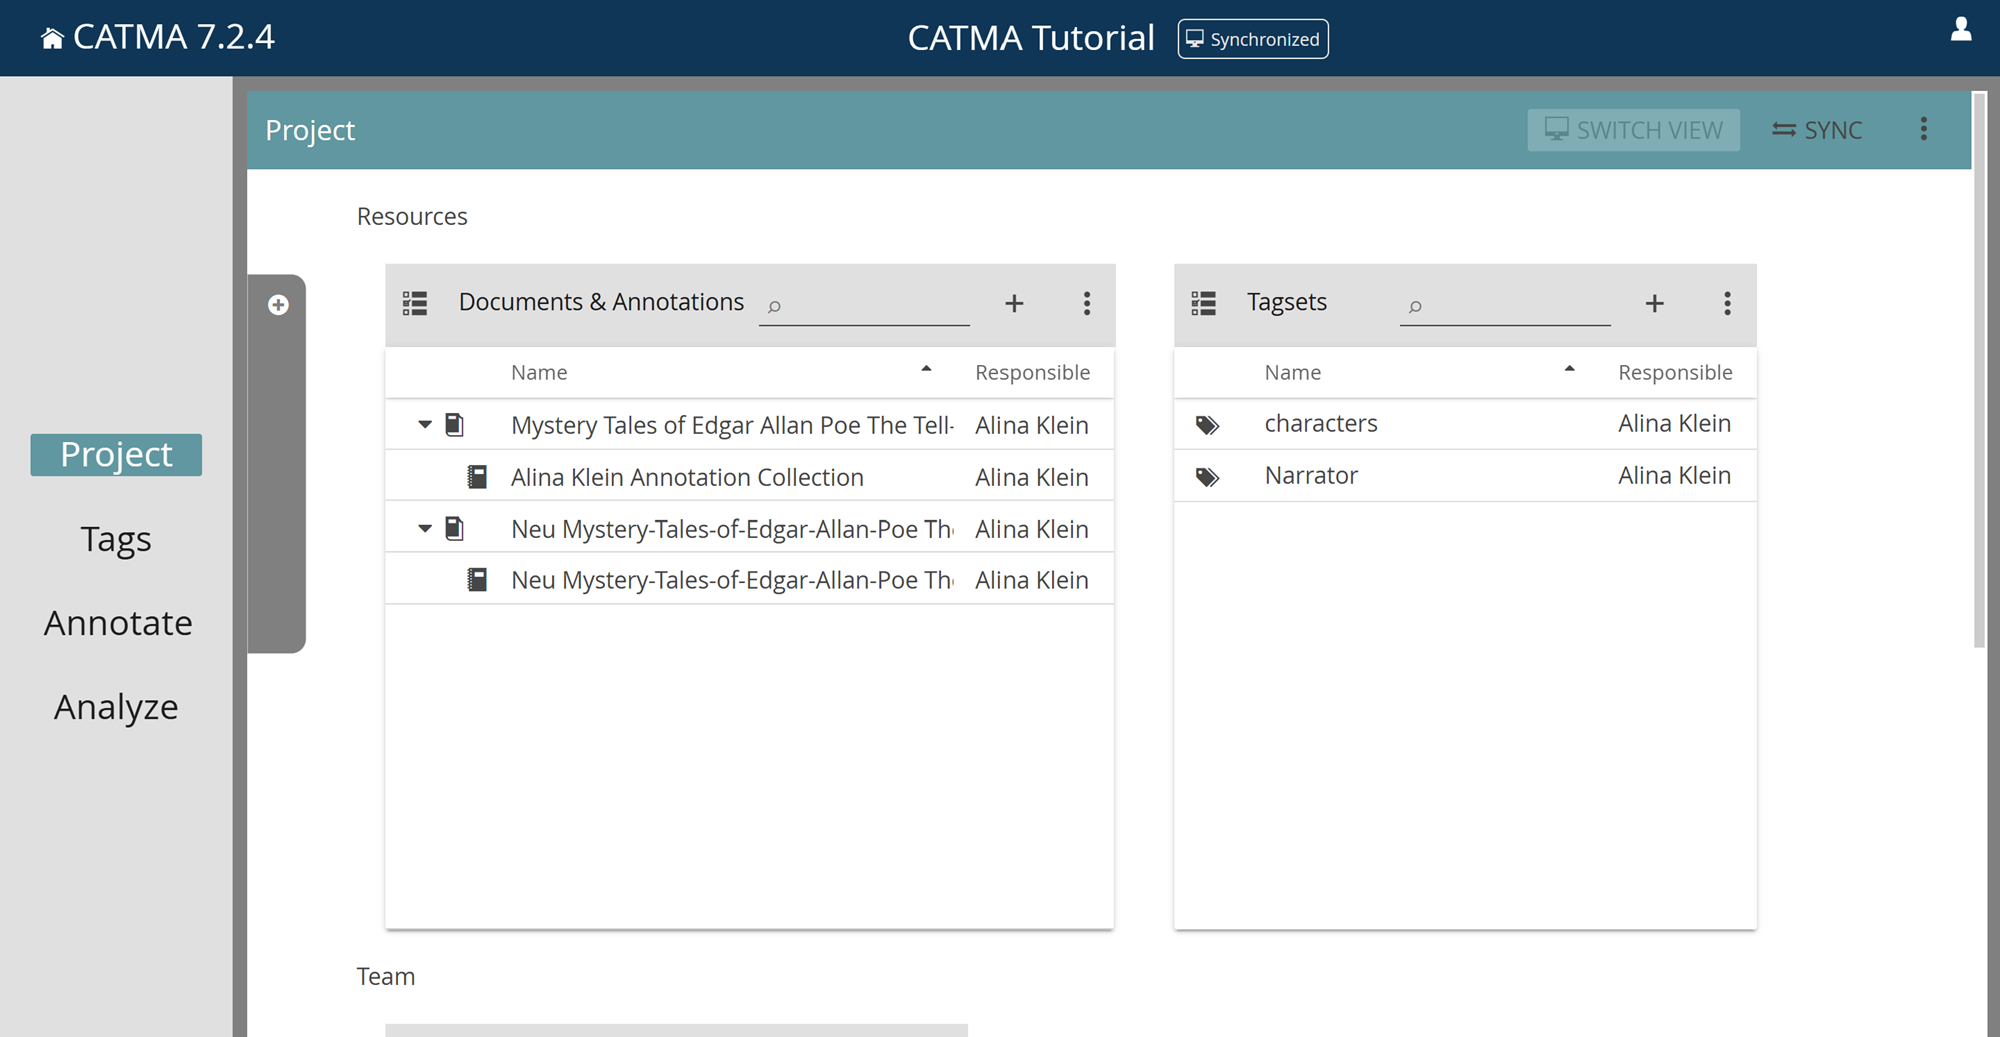
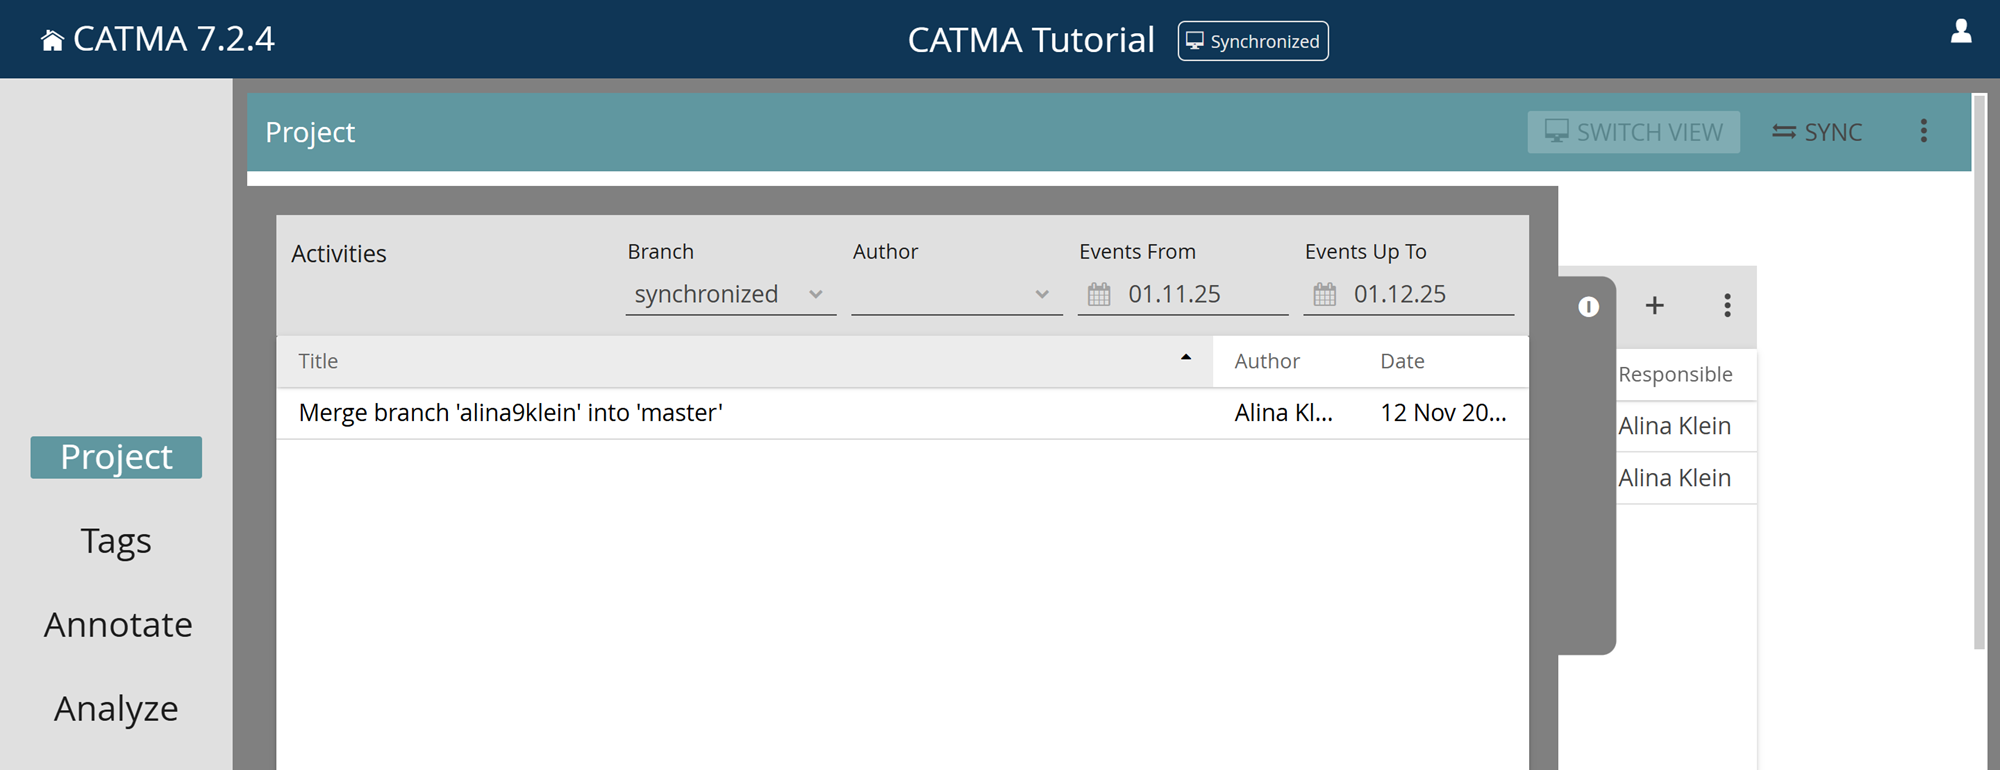
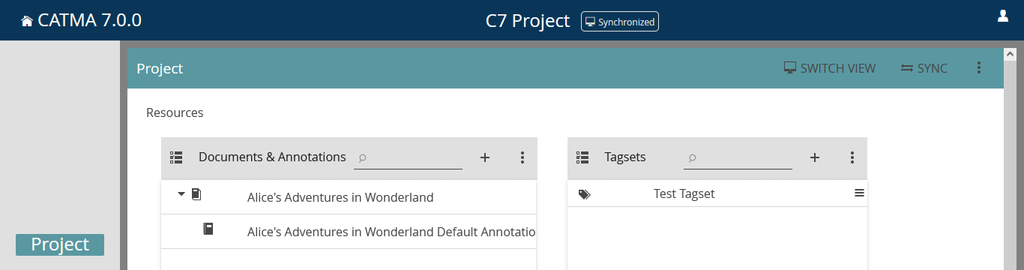
The Project module shows all the components of your project and allows you to manage them. Each component class is displayed in a tile or panel: there is one tile for your Documents & Annotations, one for the Tagsets belonging to the project, and one for project Members. There is also a drawer on the left that shows you all the activities of the project (who did what, when). You can open it by clicking on the gray latch. You can also sort and filter the activities according to your wishes.
Documents and Annotation Collections
Add Documents
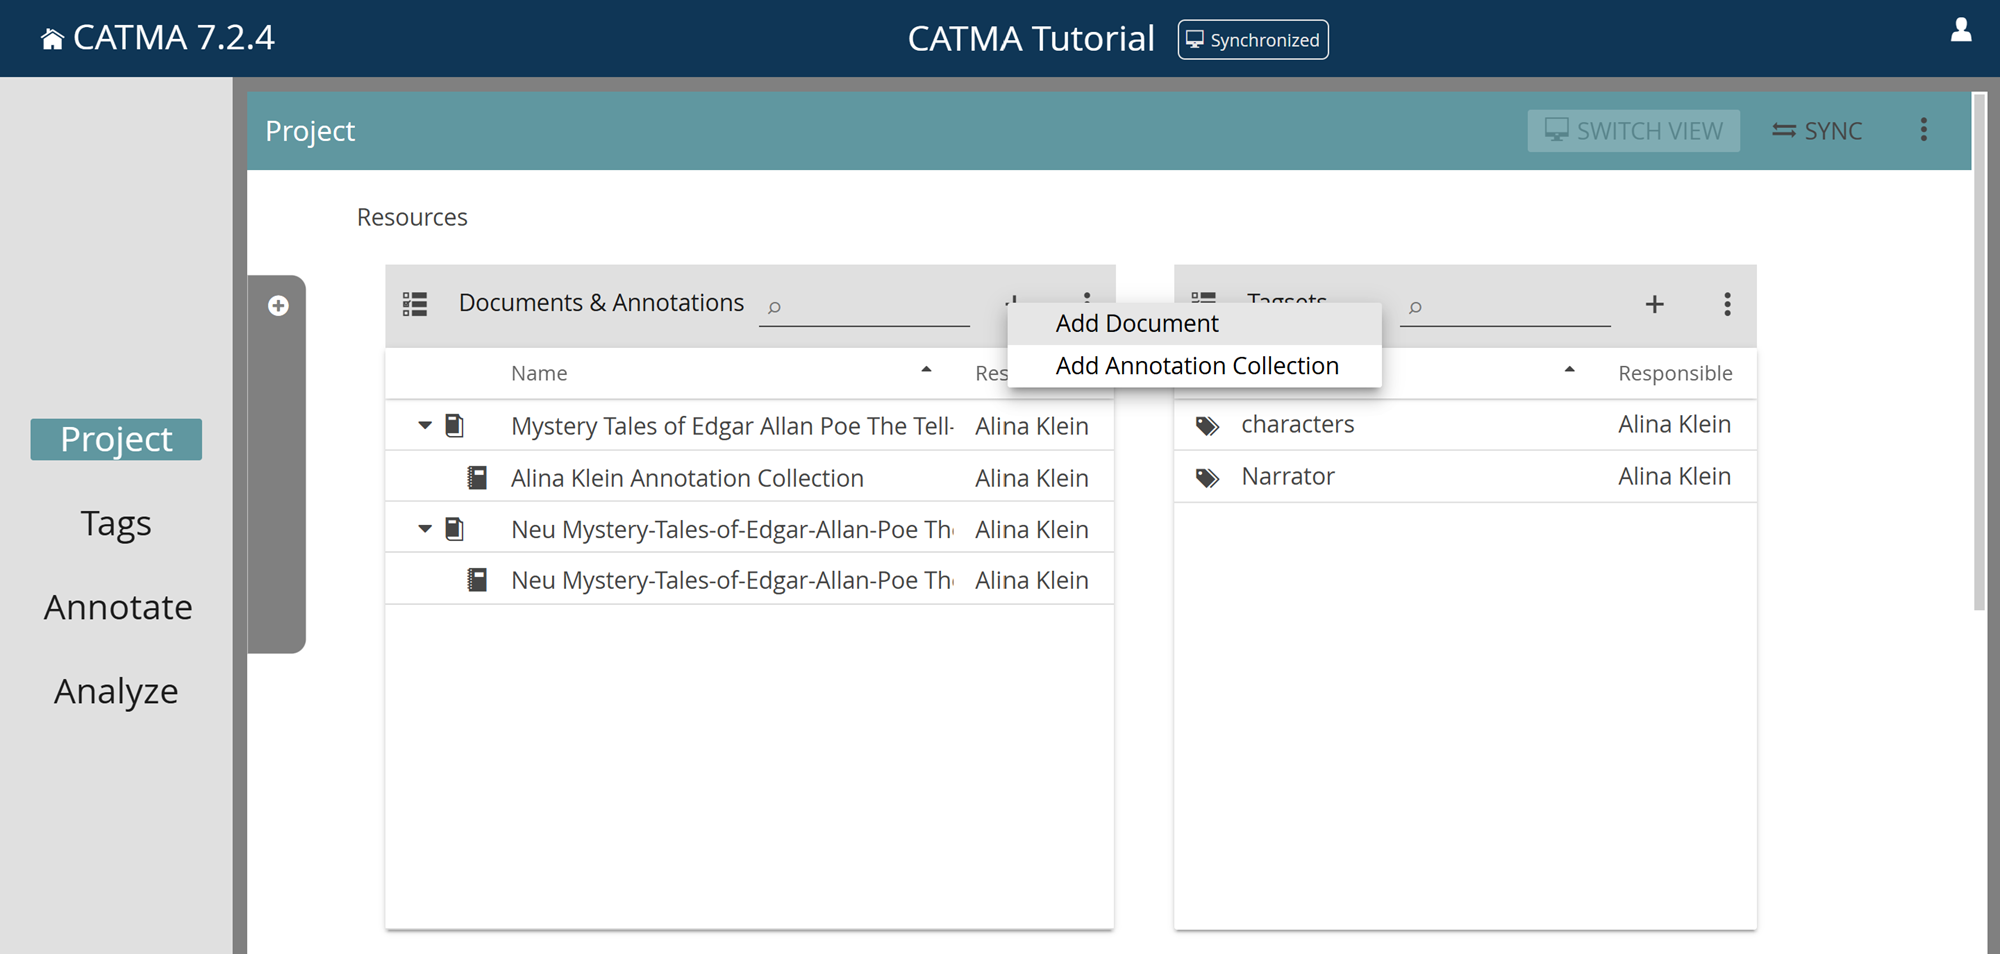
When you create your first CATMA project, there won’t be any resources – i.e., documents, annotation collections or tagsets – to show yet. To add a document, click the plus icon at the top right of the Documents & Annotations tile and select “Add Document“. You will now be guided by a wizard interface: upload a document from your computer or add one via a public URL in step 1, see a preview of the document and change technical parameters in step 2, add or change metadata (like title or author) in step 3, and optionally alter the pattern for the generation of annotation collection names in step 4. Once completed, the newly added document will be displayed in the Documents & Annotations tile.
Edit or Delete Documents
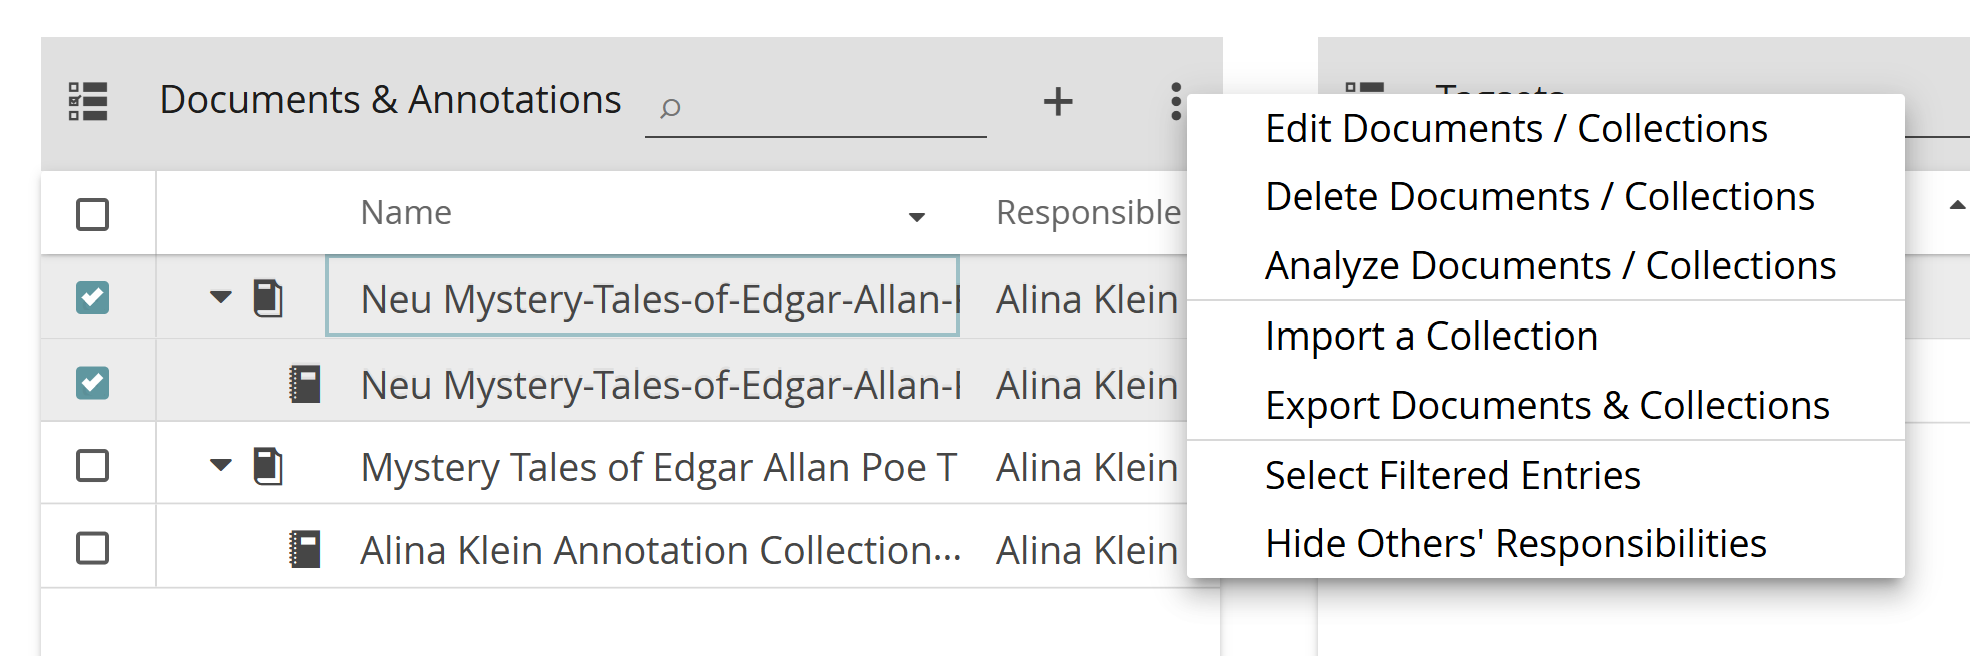
If you want to edit or delete a document, select it from the list and click the three-dot menu in the upper-right corner of the Documents & Annotations tile. Here you can select “Edit Documents / Collections” or “Delete Documents / Collections“. (Please note that the editing options for documents are confined to the metadata – for technical reasons it’s not possible to alter the actual document text once it has been added.) If you want to select more than one document, you can switch on tickable checkboxes using the icon in the top-left corner of the tile.
Please note that you can only edit or delete documents if your project role allows it.
Add Annotation Collections
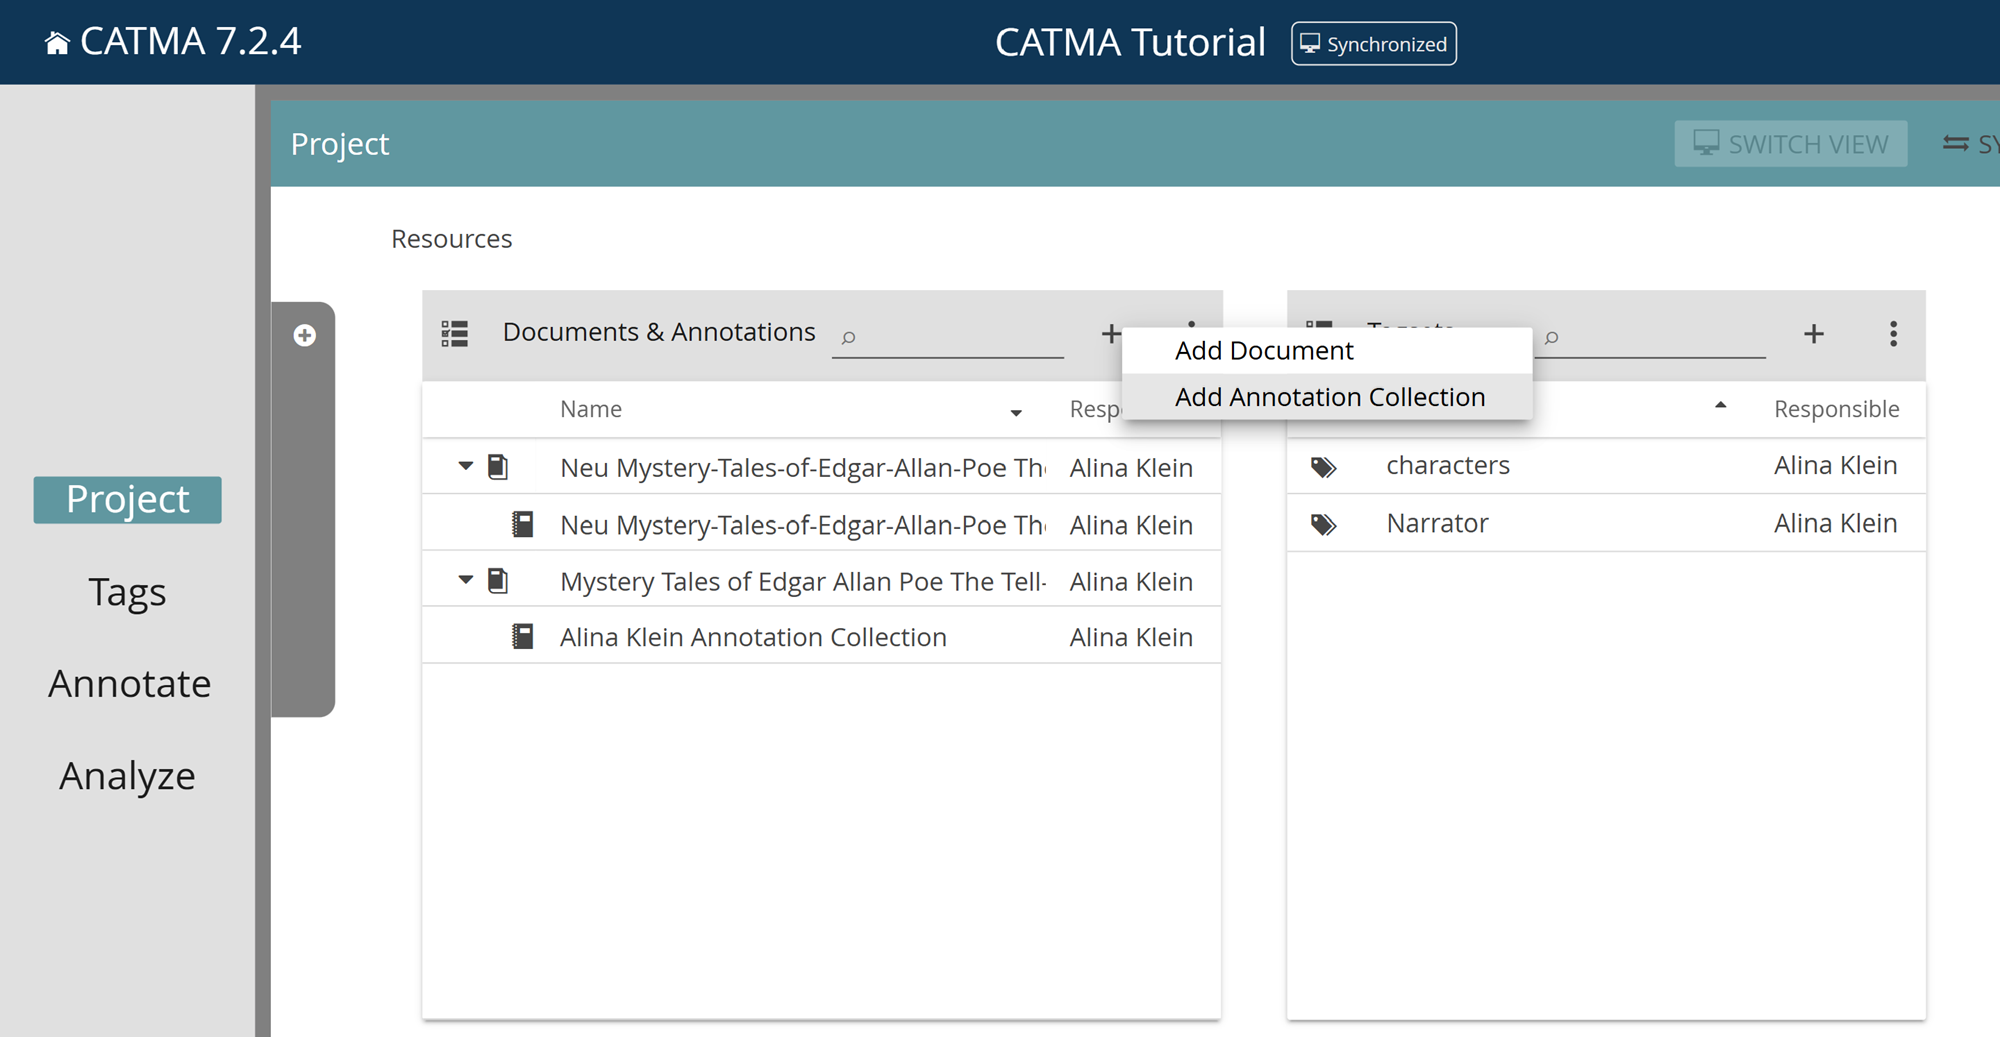
In CATMA, annotations are stored separately from the documents to which they relate, in so-called Annotation Collections. In order to annotate a document, there must be at least one of these collections. A first one was created automatically when you added the document, which you can rename or delete if you so wish. A document can have multiple collections. To create an annotation collection, simply select one document or several documents, click the plus icon and select “Add Annotation Collection“. Enter your collection’s name, confirm, and the annotation collection will be displayed beneath the associated document.
Edit or Delete Annotation Collections
To edit or delete annotation collections, select them from the list, click the three-dot menu and choose the relevant option. (Please note that, in the Project module, the editing options for annotation collections are confined to the metadata. Annotations can be created or modified in the Annotate module, to which we will get later.)
Please note that you can only edit or delete annotation collections if your project role allows it.
Tagsets
Add Tagsets
The next tile or panel in the Project module shows the so-called Tagsets associated with the project. Tagsets contain the annotation categories (tags) that are needed if you want to annotate documents in CATMA.
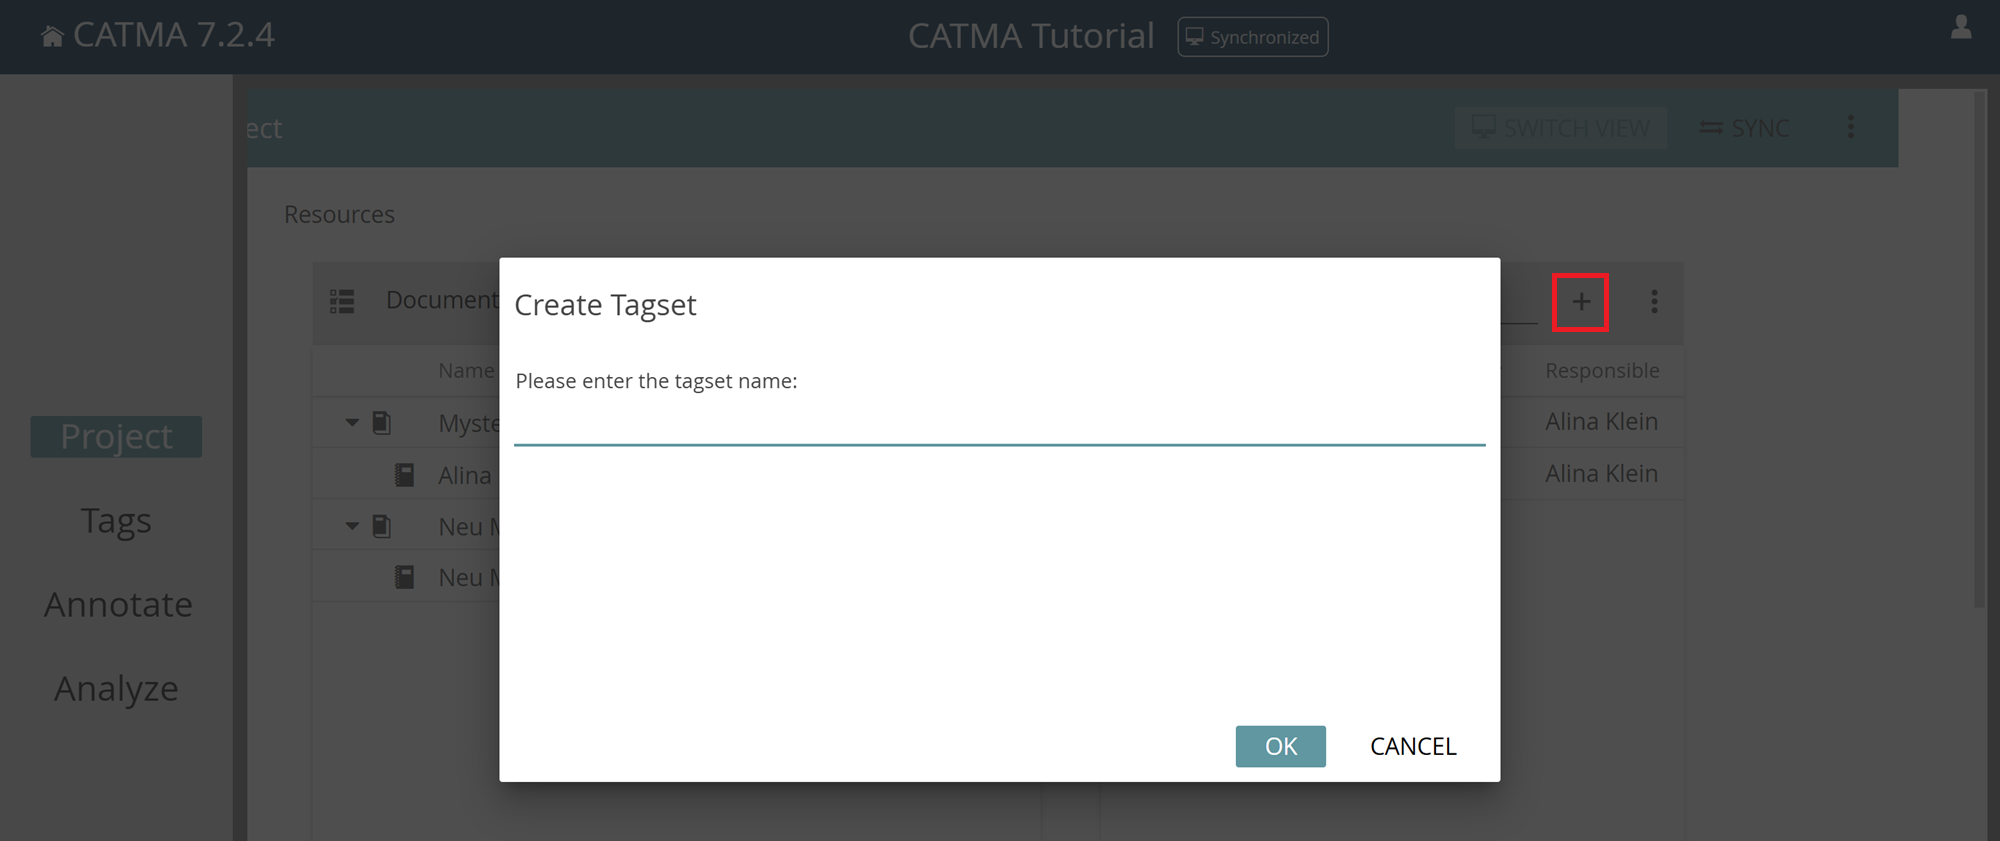
To add a tagset, click the plus icon at the top right of the Tagsets tile, type in a name and confirm.
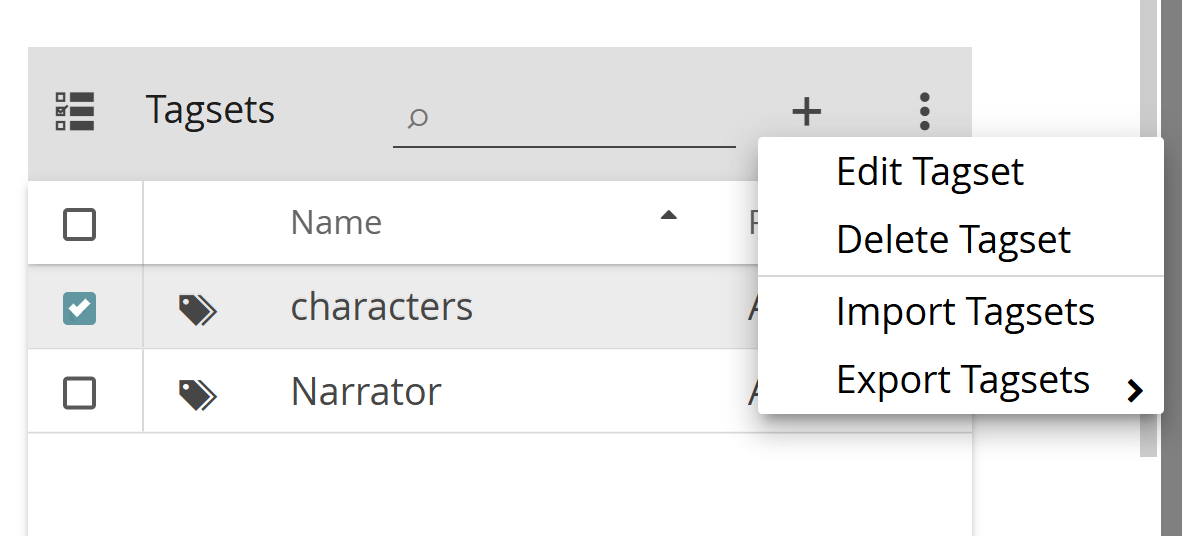
Edit or Delete Tagsets
To edit or delete a tagset, select it from the list, click the three-dot menu and choose the relevant option. (Please note that, in the Project module, the editing options for tagsets are confined to the metadata. Tags can be created or modified in the Tags module, to which we will get later.)
Please note that you can only edit or delete tagsets if your project role allows it.
Members
Add Members
The third tile or panel in the Project module shows the project Members and their Roles. It will display at least the project owner, plus any other users and groups that have been added to the project.
If your role allows it, you can add new members to the project in several ways:
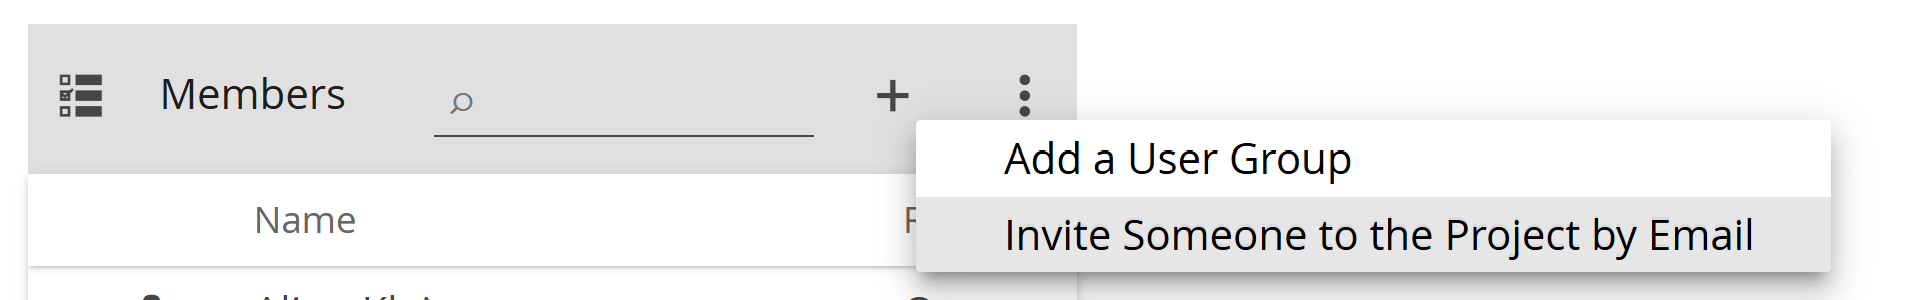
The standard and probably easiest way is to invite one or more new members to the project via email. First, click on the plus icon at the top right of the Members tile and select “Invite Someone to the Project by Email“.
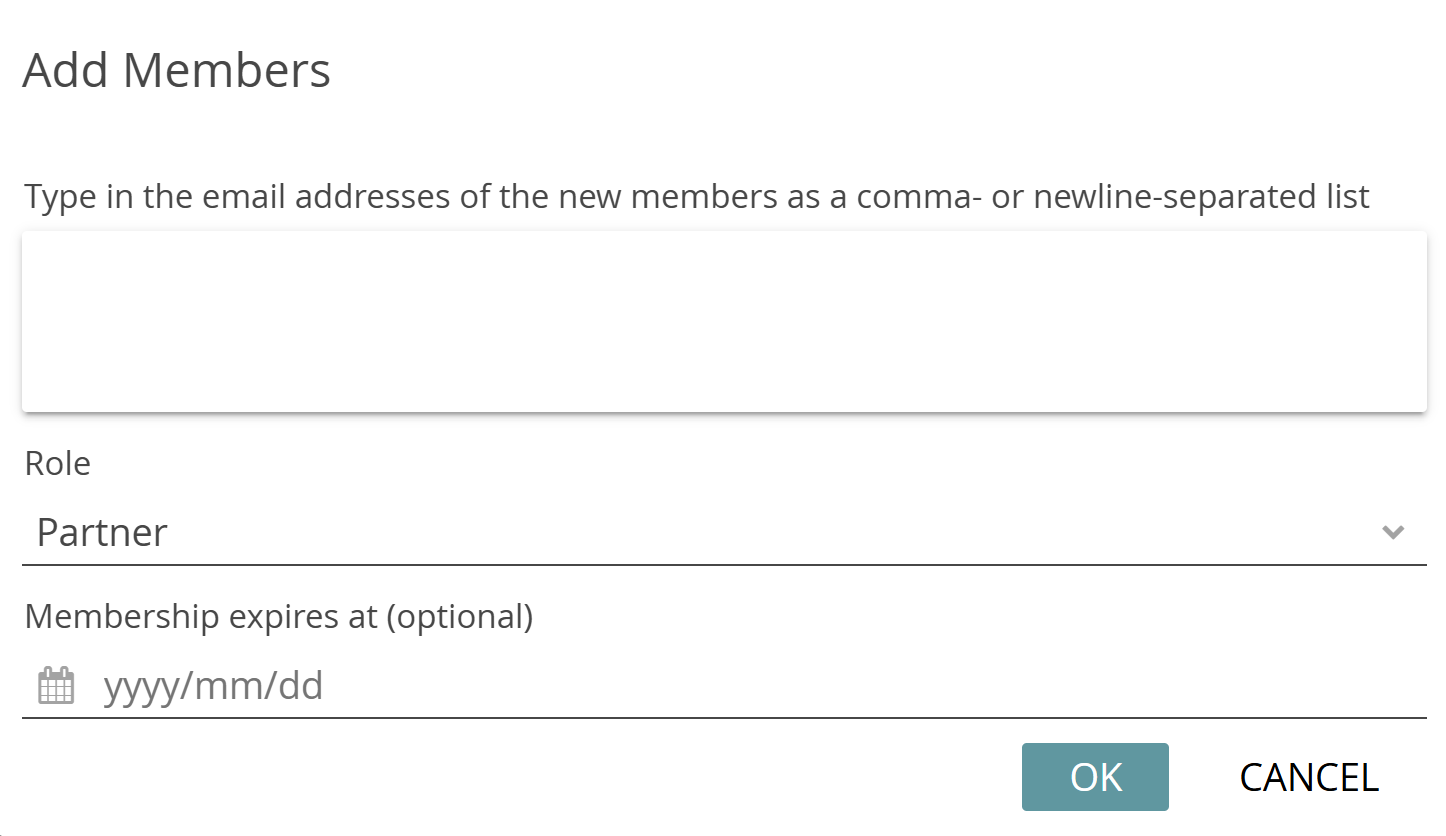
In the pop-up dialog that appears, enter the email addresses of the people you want to invite and select their role in the project from the drop-down menu. All invited persons are assigned the same role. Optionally, you can also enter a date on which the invitees’ project membership will expire. Click “OK” to send the invitations to the invitees by email.
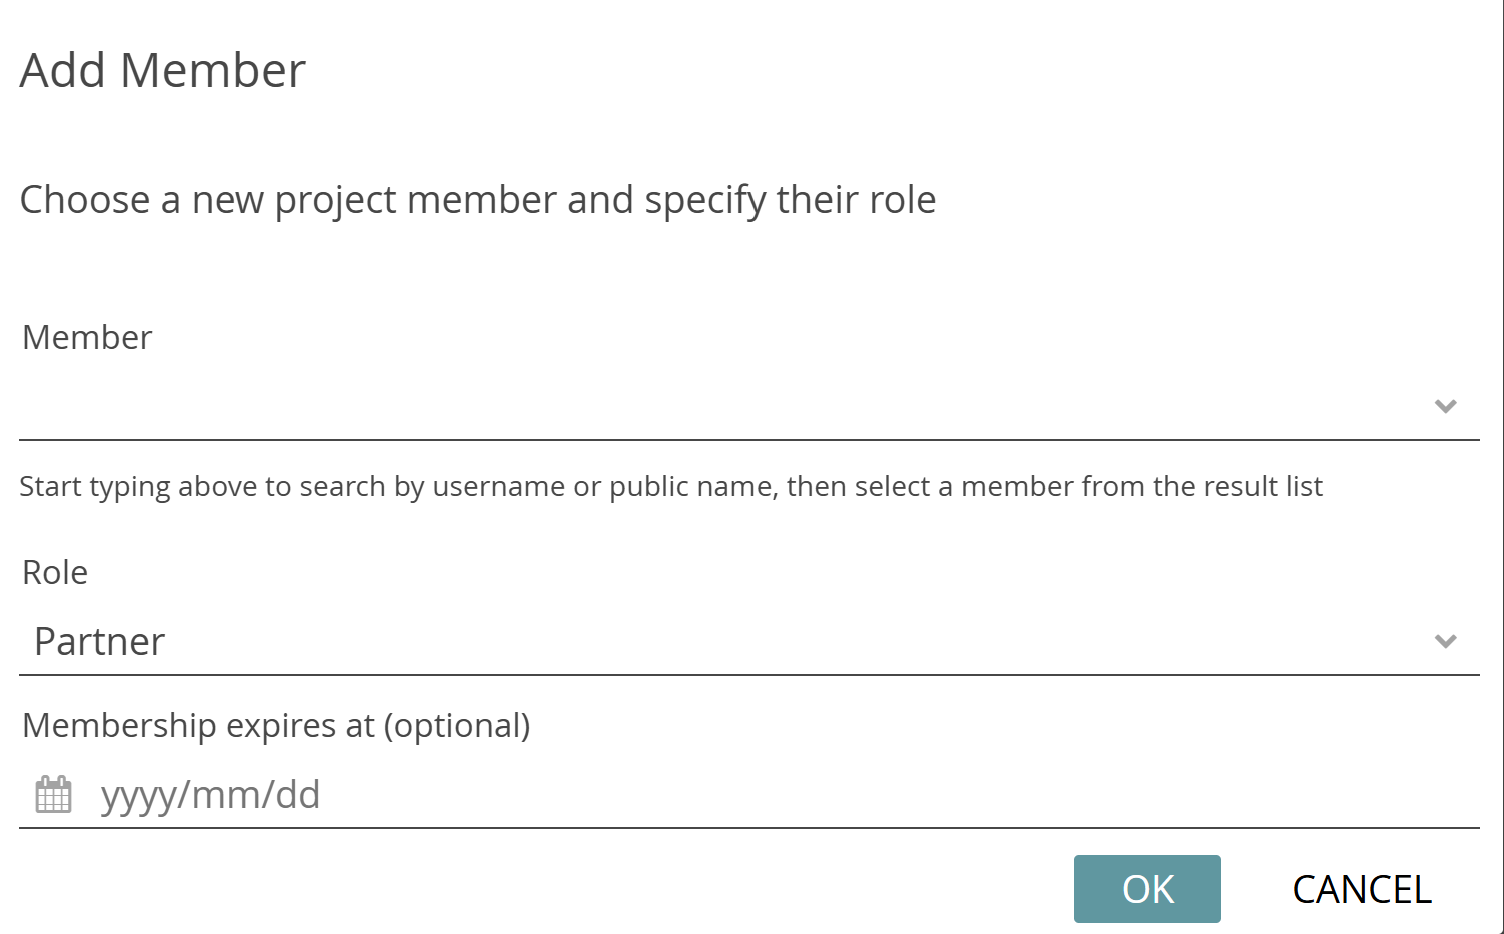
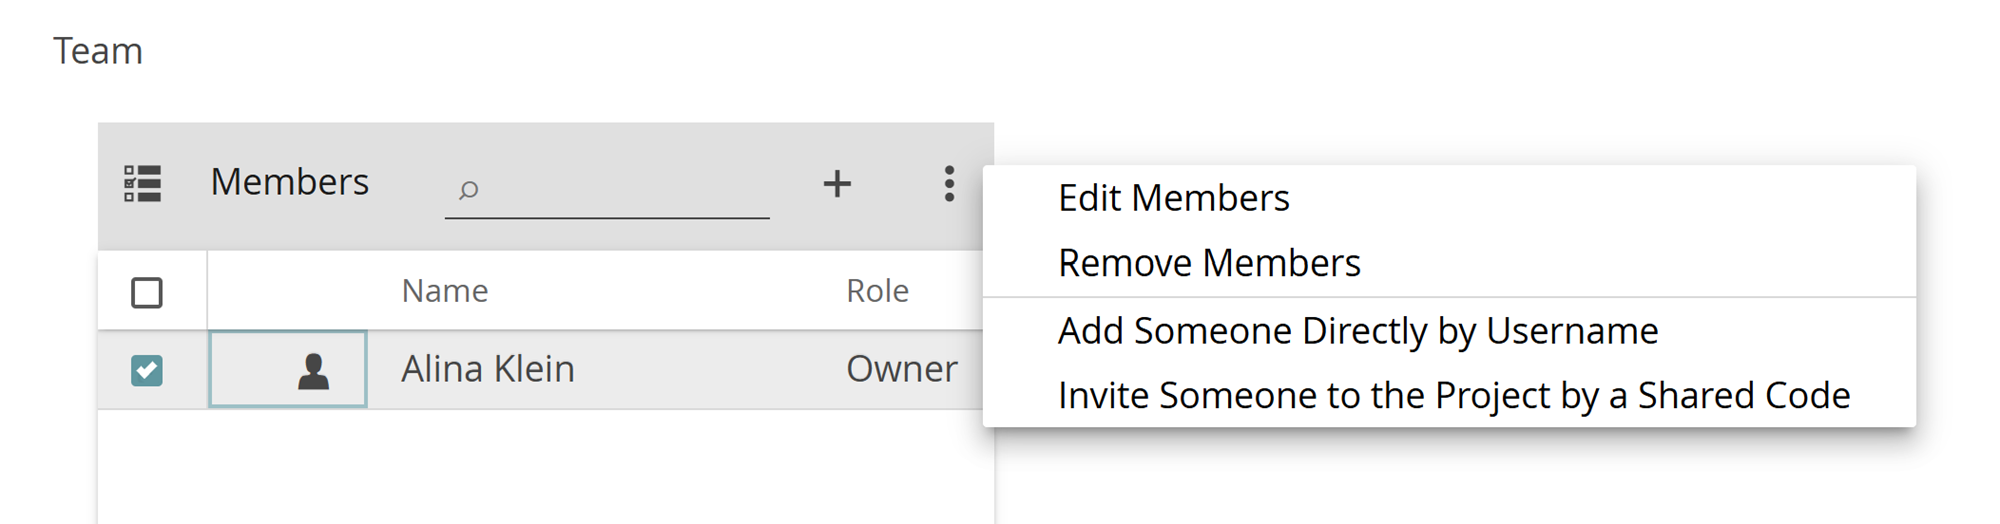
If you only want to add one or a few members to the project, you can alternatively add the persons directly via their CATMA username. Click on the three-dot menu and select “Add Someone Directly by Username“. Type in the username of a CATMA user you want to add and select their role from the drop-down menu. As before, you have the option of entering an expiration date. Once confirmed the new member will be displayed in the list (they are added directly without needing to accept an invitation).
One way to add a large number of new members is to create a user group and add it to the project. We covered the creation of User Groups above. To add a group, click the plus icon and select “Add a User Group“. The process works very similarly to adding members directly by username. Note: If a person from the user group should have a different role than the one you assigned to the group, e.g. one with more permissions, then you can add that person to the project separately using an alternative method (by email invitation or directly by username). The role with more permissions will then override the one with fewer.
Another option to add a large number of members is via a special workflow and invitation in ‘real time’, as mentioned previously under Join Project. This option may be preferred in a seminar/lecture setting. See Typical Seminar Workflow for details on how this works.
Edit or Remove Members
To edit the role of a member or remove a member, select them from the list, click the three-dot menu and choose the relevant option.
Please note that you can only edit or delete members if your project role allows it.
Roles and Responsibility
There are three available roles in CATMA: Owner, Partner and Assistant. Roles are assigned to users at the group or project level only, and each role has a specific set of permissions relating to groups or projects as a whole, as well as to the different kinds of resources contained in projects (documents, annotation collections & tagsets).
In summary:
- Owners have all possible permissions for groups and projects.
- Partners have most permissions for projects, but they cannot edit the name, description or delete a project. They have no permissions for groups.
- Assistants can create all types of resources in projects, but they cannot edit or delete resources unless they are responsible for them or have created them themselves. They have no permissions for groups.
For a full overview of the roles and their associated permissions, please see Roles and Permissions.
Together with the various roles in a project comes the concept of responsibility, which functions as a kind of guard rail. In some contexts and for technical reasons, project members cannot be prevented from changing each other’s work, but they are always warned if they try to make changes to or within resources that they are not responsible for. Each project resource records the member that is responsible for it (by default this is the person that created the resource). This can be seen in the Project module in the column Responsible. Responsibility can be changed by editing the relevant resource.
Creating a Copy of a Project
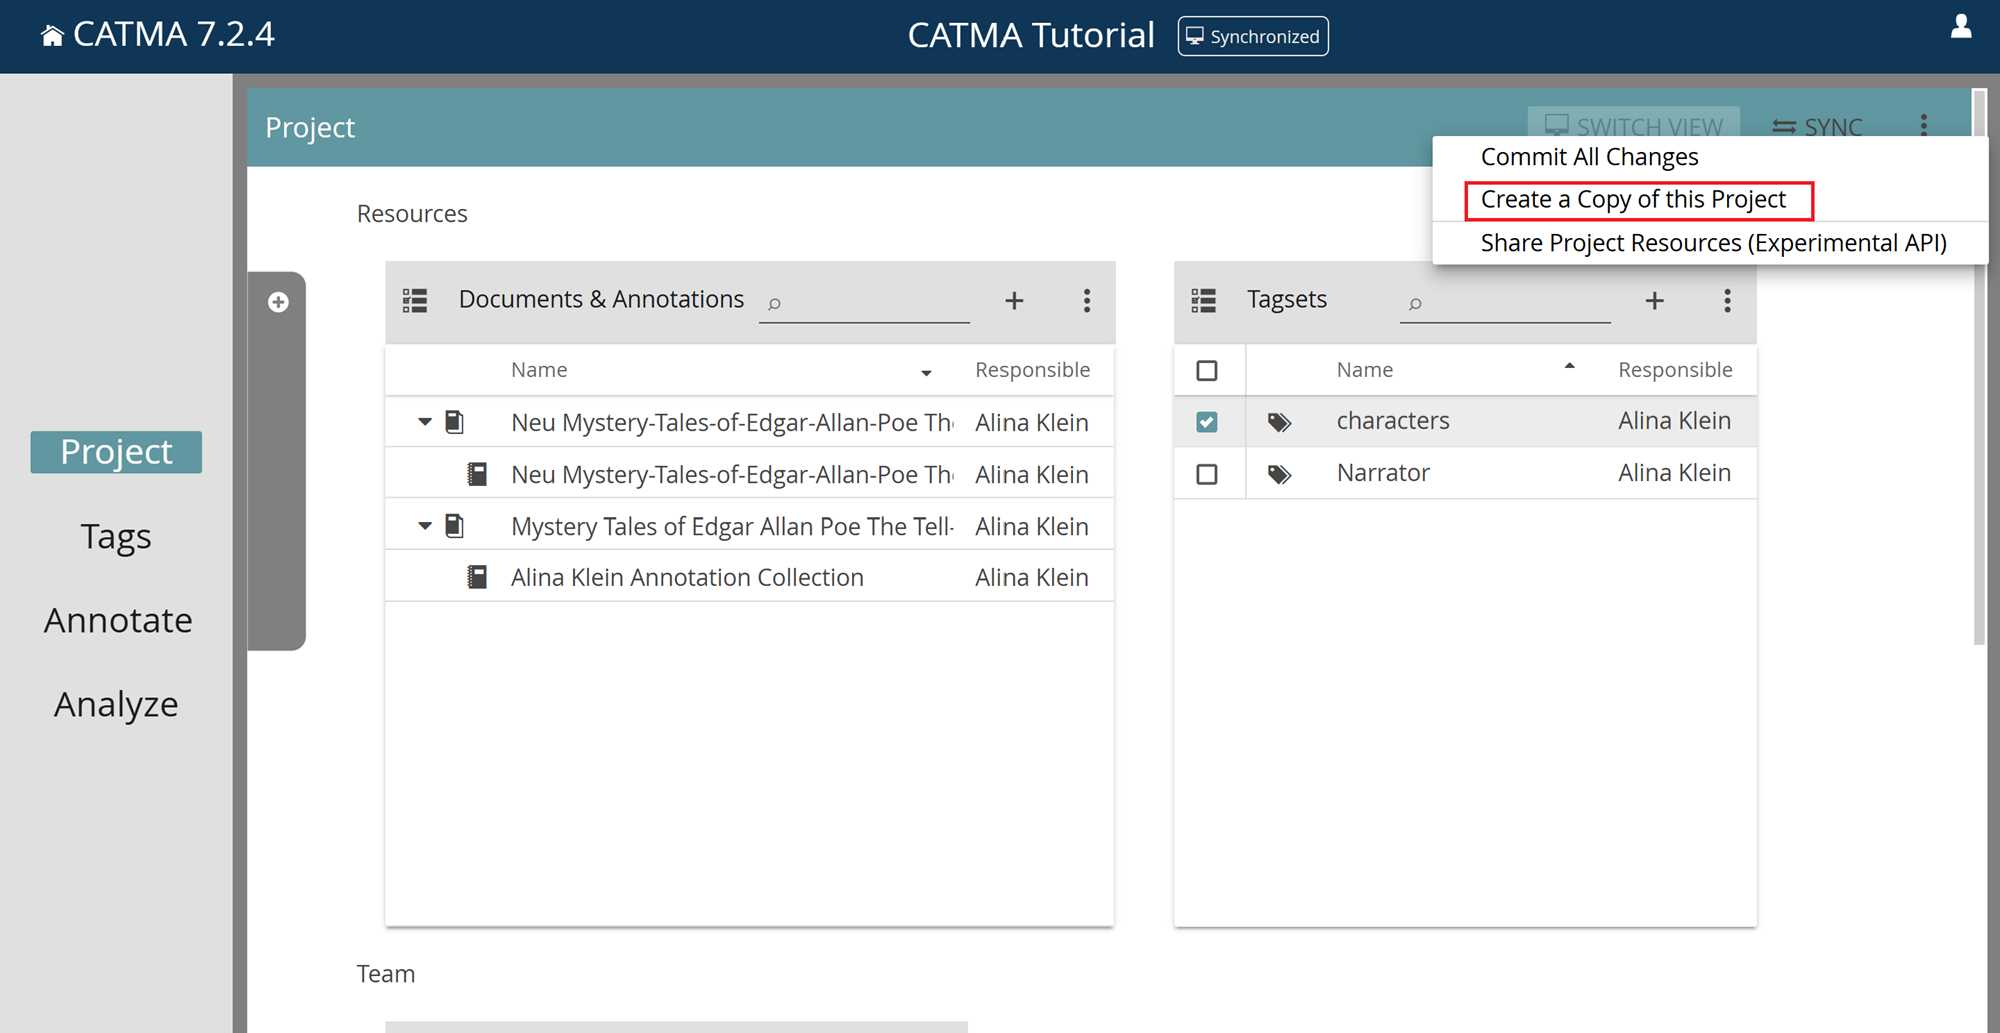
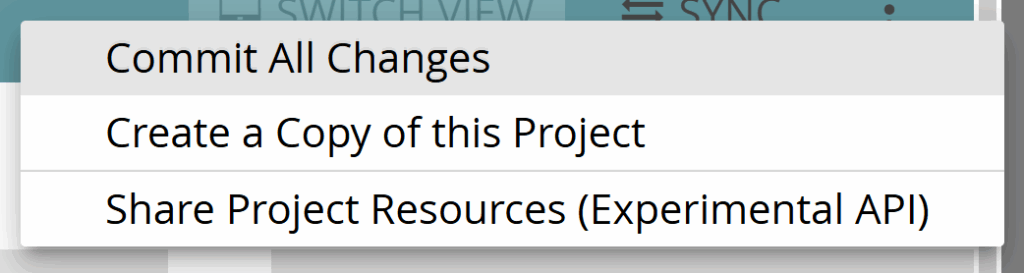
In some situations it might be useful to create a copy of a project without including the current members in the copy. For example, you may want to reuse an existing project with a different group of people. To do this, click on the three-dot menu in the upper-right corner of the Project module and select “Create a Copy of this Project“. You will be prompted to enter the name and optionally a description for the newly copied project. After a short loading process, you can select the resources (documents, annotation collections and tagsets) you want to keep in the copy. After confirming your selection, you will be taken to the Project module of the newly copied project. When you return to your dashboard, the newly copied project will be displayed as a project tile.
Synchronization
Each member of a CATMA project works on their own copy of the project, independent of the other project members, until they decide to synchronize. Synchronization is the process whereby your copy or version of the project is integrated with the “master” version. As an analogy, you can think of each member’s copy as a draft version of a document, while there is also a final (“master”) version of the document, that may or may not already include some or all of the sections of the various draft versions.
When you make changes to the project, they are automatically saved in your personal copy of the project. However, CATMA does not automatically synchronize them. Instead, you must choose when you want to do this.
This is because you might still be working on a specific task that you have not yet completed, or because you might not want to share your changes with other project members yet. In other words, you can choose when you want to share your work, and when you want to fetch the work of others and integrate it with your own. In addition, it isn’t always possible to integrate everyone’s work completely automatically. There may be so-called merge conflicts, and a choice between conflicting alterations may need to be made, or they may need to be combined in some way.
Synchronization is only needed when you truly want to integrate multiple people’s work in a collaborative project. At this point it is worth noting that, because synchronization may fail or be blocked due to conflicts, there is an alternative way to see what other project members have been doing. See Collaborative Project View Modes below for more information.
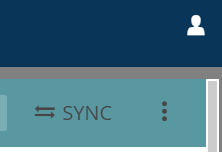
When you are ready to synchronize, click the “SYNC” button in the top-right corner of the Project module.
A notification will inform you whether synchronization succeeded or failed. CATMA tries to resolve most conflicts automatically, but that doesn’t always work and can lead to an error. If you are experiencing a problem while synchronizing, please Contact the support team.
Note that, currently, CATMA does not tell you when other people have made changes that you could synchronize.
Also note that synchronization always needs to occur on “both ends”. To explain this, let’s return to the analogy of a document with one final and multiple draft versions. User A has created draft A while user B has created draft B, and both now want to integrate and share their work with each other. User A synchronizes, thereby integrating their changes into the final version (F). Before user B can see user A’s changes, they too need to synchronize. This will integrate their own changes into F, creating a version of F that contains both users’ changes. For user A to now see user B’s changes they would need to synchronize again, because F did not yet contain user B’s changes the last time user A synchronized.
Therefore, in projects with multiple members, synchronization may need to be performed multiple times before all members are up to date with the latest version.
Collaborative Project View Modes
CATMA has two different collaborative project view modes:
- Synchronized, showing the state of the project since you last synchronized, plus everything that you have done on top of that, and …
- Latest Contributions, allowing for read-only access to all project members’ latest work — an additive view that combines the current integrated project state with the latest changes, without the need for synchronization or potentially complicated integration and conflict resolution work up front
In collaborative projects, that is projects with more than one member, the “SWITCH VIEW” button (next to “SYNC”) is enabled to allow for switching between the view modes.
The default view mode is Synchronized, and the currently active view mode is displayed in the title bar, next to the project name. Don’t confuse the Synchronized view with synchronization itself. When the badge next to the project name indicates “synchronized” it refers only to the currently active view mode.
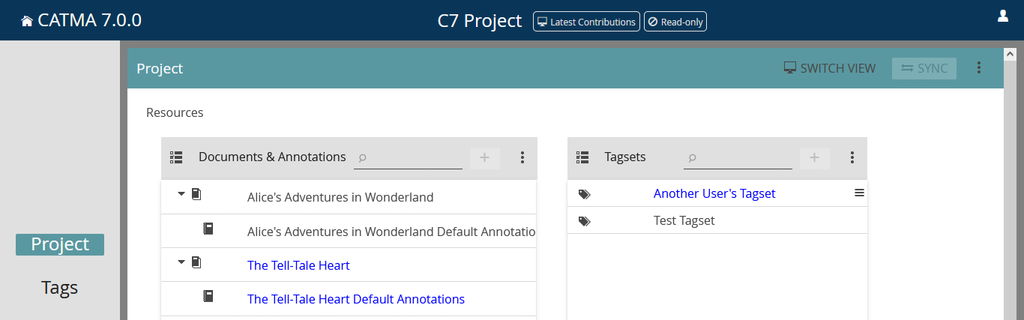
When switching to the Latest Contributions view, the project enters a read-only state and allows you to see what the other members have been up to. You can view and interact with the other members’ resources in this view, but you can’t make any changes. For example, you can view documents that they have uploaded as well as any associated annotations. You can also run queries or view visualizations in the Analyze module. The resources marked in blue have been added or modified by another project member but have not yet been synchronized. Note that the blue highlighting is confined to the Project and Tags modules, and is not present in any of the drawers where you select resources, in order to limit distractions.
Tell me more about how synchronization and the collaborative project view modes work
To understand how synchronization works in detail, it’s necessary to know a little bit about CATMA’s infrastructure. CATMA uses a GitLab server as its backend, and CATMA projects are essentially just Git repositories.
Within each project repository, there are multiple branches: the main or master branch, and an extra branch for each of the project members. This model serves as the foundation for all aspects of synchronization: users work in their own branches and synchronize to integrate or merge their changes into the master branch.
Every user has their own copy of the project on the CATMA server. With Git, this copy is known as the Working Tree. The working tree, or working directory, is the umbrella term for all the directories and files in the project. It is a copy of a particular version of the project that you are busy working on. If you are familiar with Git, you’ll know that this usually resides on your local computer, but since CATMA is a web application, we keep it on the server for you. (Of course you can also work with it locally, but that is an advanced topic – see Git Access if you’re interested.)
Instead of forcing you to work with Git directly, the CATMA UI offers an easier and more user-friendly built in synchronization mechanism that tries to perform all the necessary Git operations for you (fetching and merging, committing and pushing).
As mentioned previously, synchronization is needed when you truly want to integrate multiple people’s work in a collaborative project. Clicking the “SYNC” button starts the process of integrating your changes with the most recent integrated project state. In other words, it attempts to integrate anything you have done since you last synchronized. This can lead to conflicts (where two or more project members have made conflicting changes), which sometimes have to be resolved manually.
Using Git and GitLab terminology, synchronization creates a Merge Request (a.k.a. Pull Request) to merge your user branch into the main or master branch. Where possible, this merge request is automatically merged. If an automatic merge is not possible, the merge request remains open and can be inspected in the GitLab backend. Users with the appropriate know-how are able to take action themselves, alternatively they are welcome to Contact the support team.
What does this look like in practice and where do the project view modes fit in?
The following example illustrates the branch model and commits in more detail, as well as how the two project view modes relate to the synchronization process:
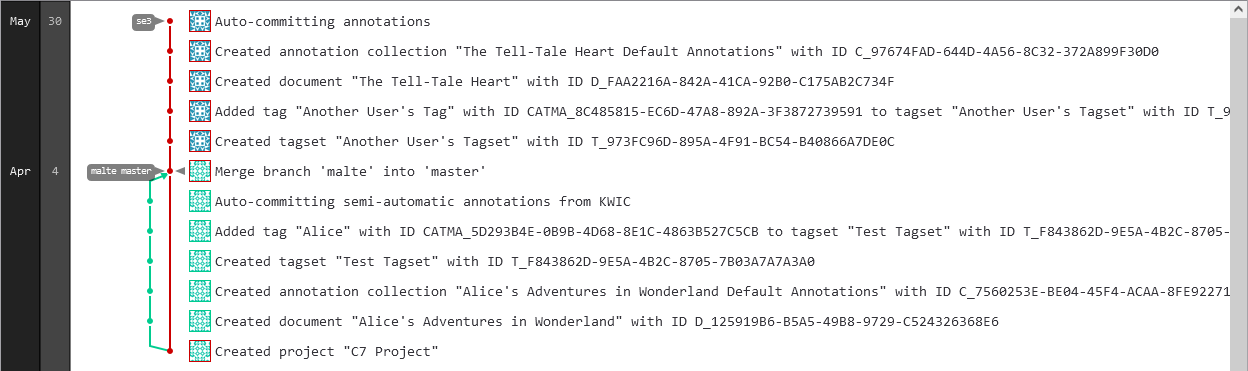
The project represented above (the same project as in Collaborative Project View Modes) has three branches – the main or master branch, and a branch for each of the project members, in this case malte and se3. Reading from the bottom up, the first red dot shows the creation of the project, which is a commit on the master branch.
The green line and dots show commits that were automatically made on the malte branch. After creating some annotations semi-automatically, malte decided that he wanted to integrate his changes with the most recent integrated project state, which at that point was still the first red dot – the point at which the project was created. He clicked the “SYNC” button, a new merge request was created and then automatically merged. The result was a new commit on the master branch, integrating the malte and master branches, which now represent the same version of the project.
Next, se3 joined the project. At this stage, the most recent integrated project state was the point at which malte was merged into master – the current state of master and thus their starting point. se3 did a few things themselves, but they did not click the “SYNC” button. Their line is shown as a continuation of master because nothing else has happened on the master branch yet.
If you now take a look at the screenshots under Collaborative Project View Modes again, things should start to fall into place. Both screenshots show the project from malte‘s point of view.
In the Synchronized view, he is looking at the current integrated project state (master branch), plus anything he has done on top of that (malte branch). Because he hasn’t done anything new since last clicking “SYNC“, the two branches are at the same point. He can’t see anything se3 did in this view, because those changes haven’t been integrated (merged) yet.
In the Latest Contributions view, he is seeing the same thing as in the Synchronized view, plus anything other project members have done but not yet synchronized (shown in blue).
If se3 now synchronized, the merge process would start over and the integrated project state, that is master, would advance to the point where se3 was merged into master (assuming a successful merge without conflicts). In this case, it’s important to note that from malte‘s perspective, the integrated project state would not change – not until he clicks “SYNC” again, to once again merge malte and master. In other words, his copy of master would be “behind” where master actually is until he synchronizes. Until then, anything new he does will only be present on the malte branch and will only be visible to others if they switch to the Latest Contributions view.
So what is a commit?
Commits are snapshots of your entire [CATMA project] at specific times. […] Over time, commits should tell a story of the history of your [project] and how it came to be the way that it currently is.
GitHub Git Guides: “Git Commit”. GitHub. URL: https://github.com/git-guides/git-commit [Last accessed: 19.05.2021].
You can use commits to document units of work, or “logical units of change”. For example, imagine a commit with the message: “Added character annotations for chapter 1”.
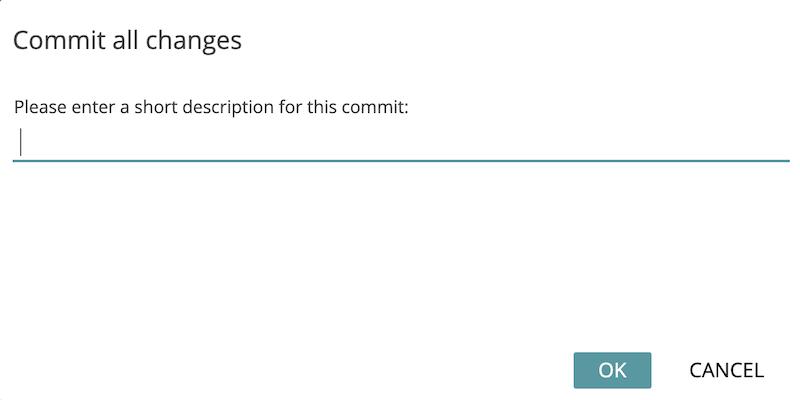
CATMA commits most things automatically – for example when you add or modify resources like documents, annotation collections, or tagsets and their tags. A commit will also be created automatically if you close a document that you are busy annotating in the Annotate module, or if you switch projects or log out (if there are uncommitted changes). This is a small safety net that prevents you from ending up with a huge number of uncommitted changes. Annotations are not committed automatically (apart from the exceptions already mentioned, or if you use the semi-automatic annotation feature – see the KWIC Visualization for more information about that). This allows you to manually create commits for units of annotation work, as in the example above, if you want to. If you would like to make a manual commit of your changes, navigate to the three-dot menu in the top-right corner of the Project module and select the option “Commit all changes“.
You will be prompted to enter a description for the commit – your unit of work – also known as a commit message.
Tags Module
Enter the Tags Module
If you want to annotate documents in CATMA, you need at least one Tagset. A tagset can either be imported from an XML file (via the three-dot menu on the Tagsets tile in the Project module) or created directly in CATMA. While the tagset (i.e., the ‘container’ for your tags) can be created in the Project module, the tags themselves can only be added/modified via the Tags or Annotate modules. To enter the Tags module, either click on “Tags” in the side menu or double-click a tagset in the Project module.
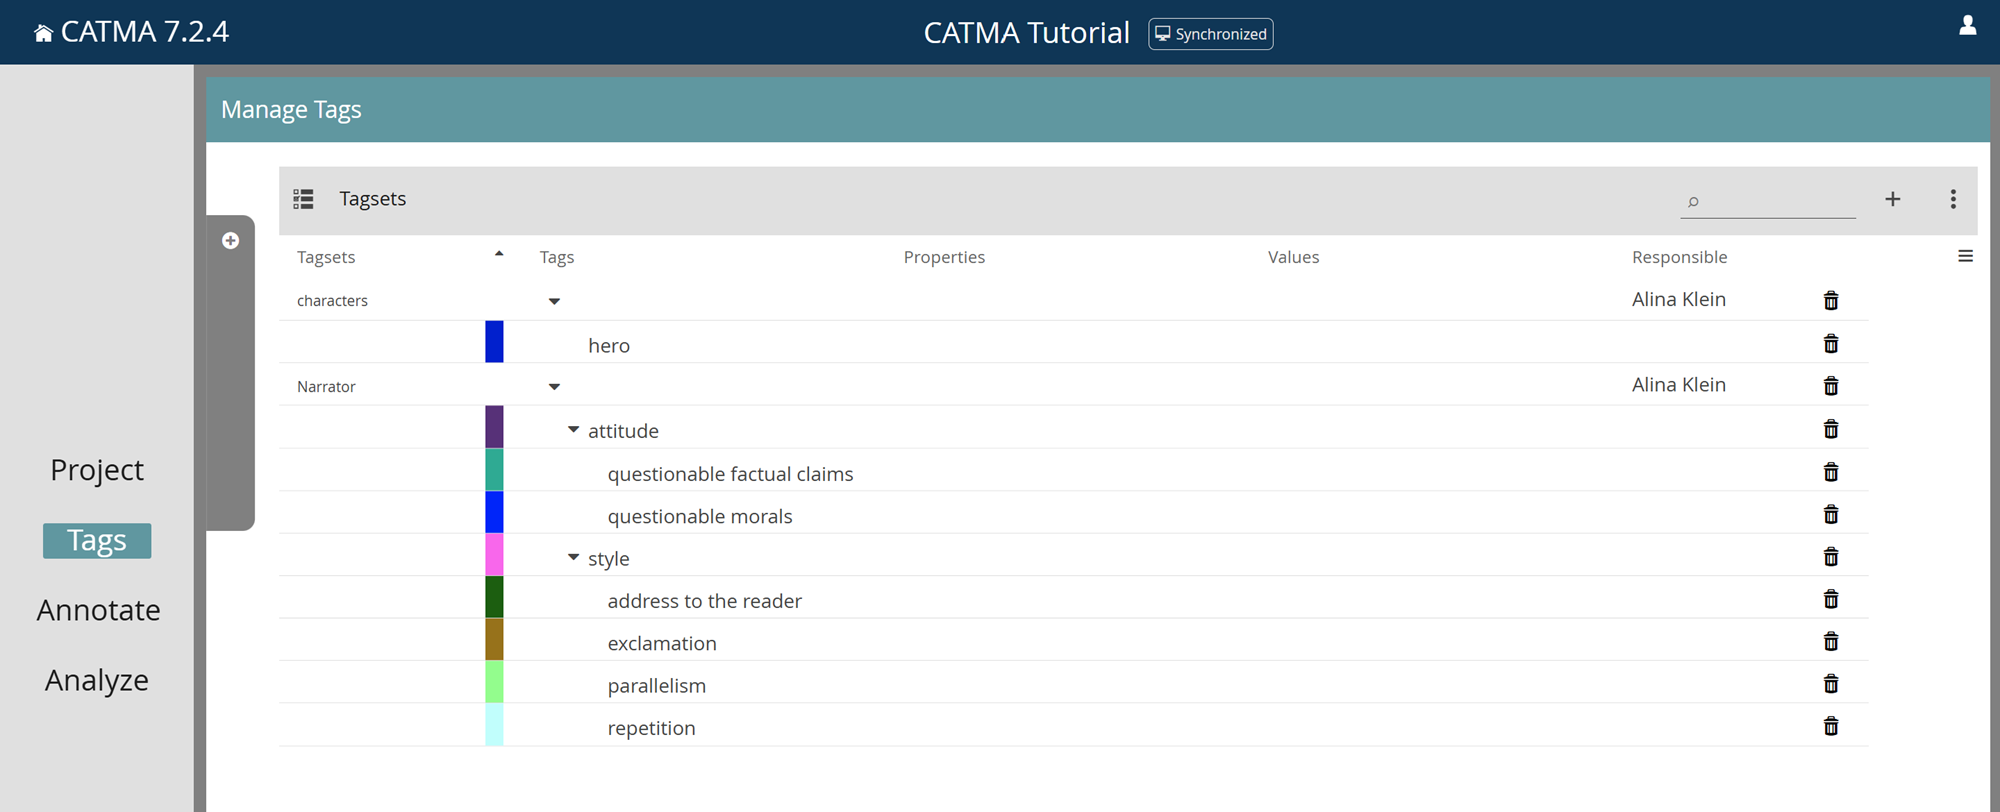
Set Filters
The Tags module displays the tagsets of your project in a table. You can see which of these tagsets are currently selected, as well as the inactive ones, by opening the gray drawer on the left (click on the gray latch). In the Tags, Annotate and Analyze modules, this drawer is used to set your filters, i.e., to select the resources that are displayed and active.
Note that when you enter the Tags module via the side menu for the first time after opening a project, your filters will be set to display all tagsets. If, however, you enter the module by double-clicking a tagset in the Project module, your filters will be set to display only that specific tagset.
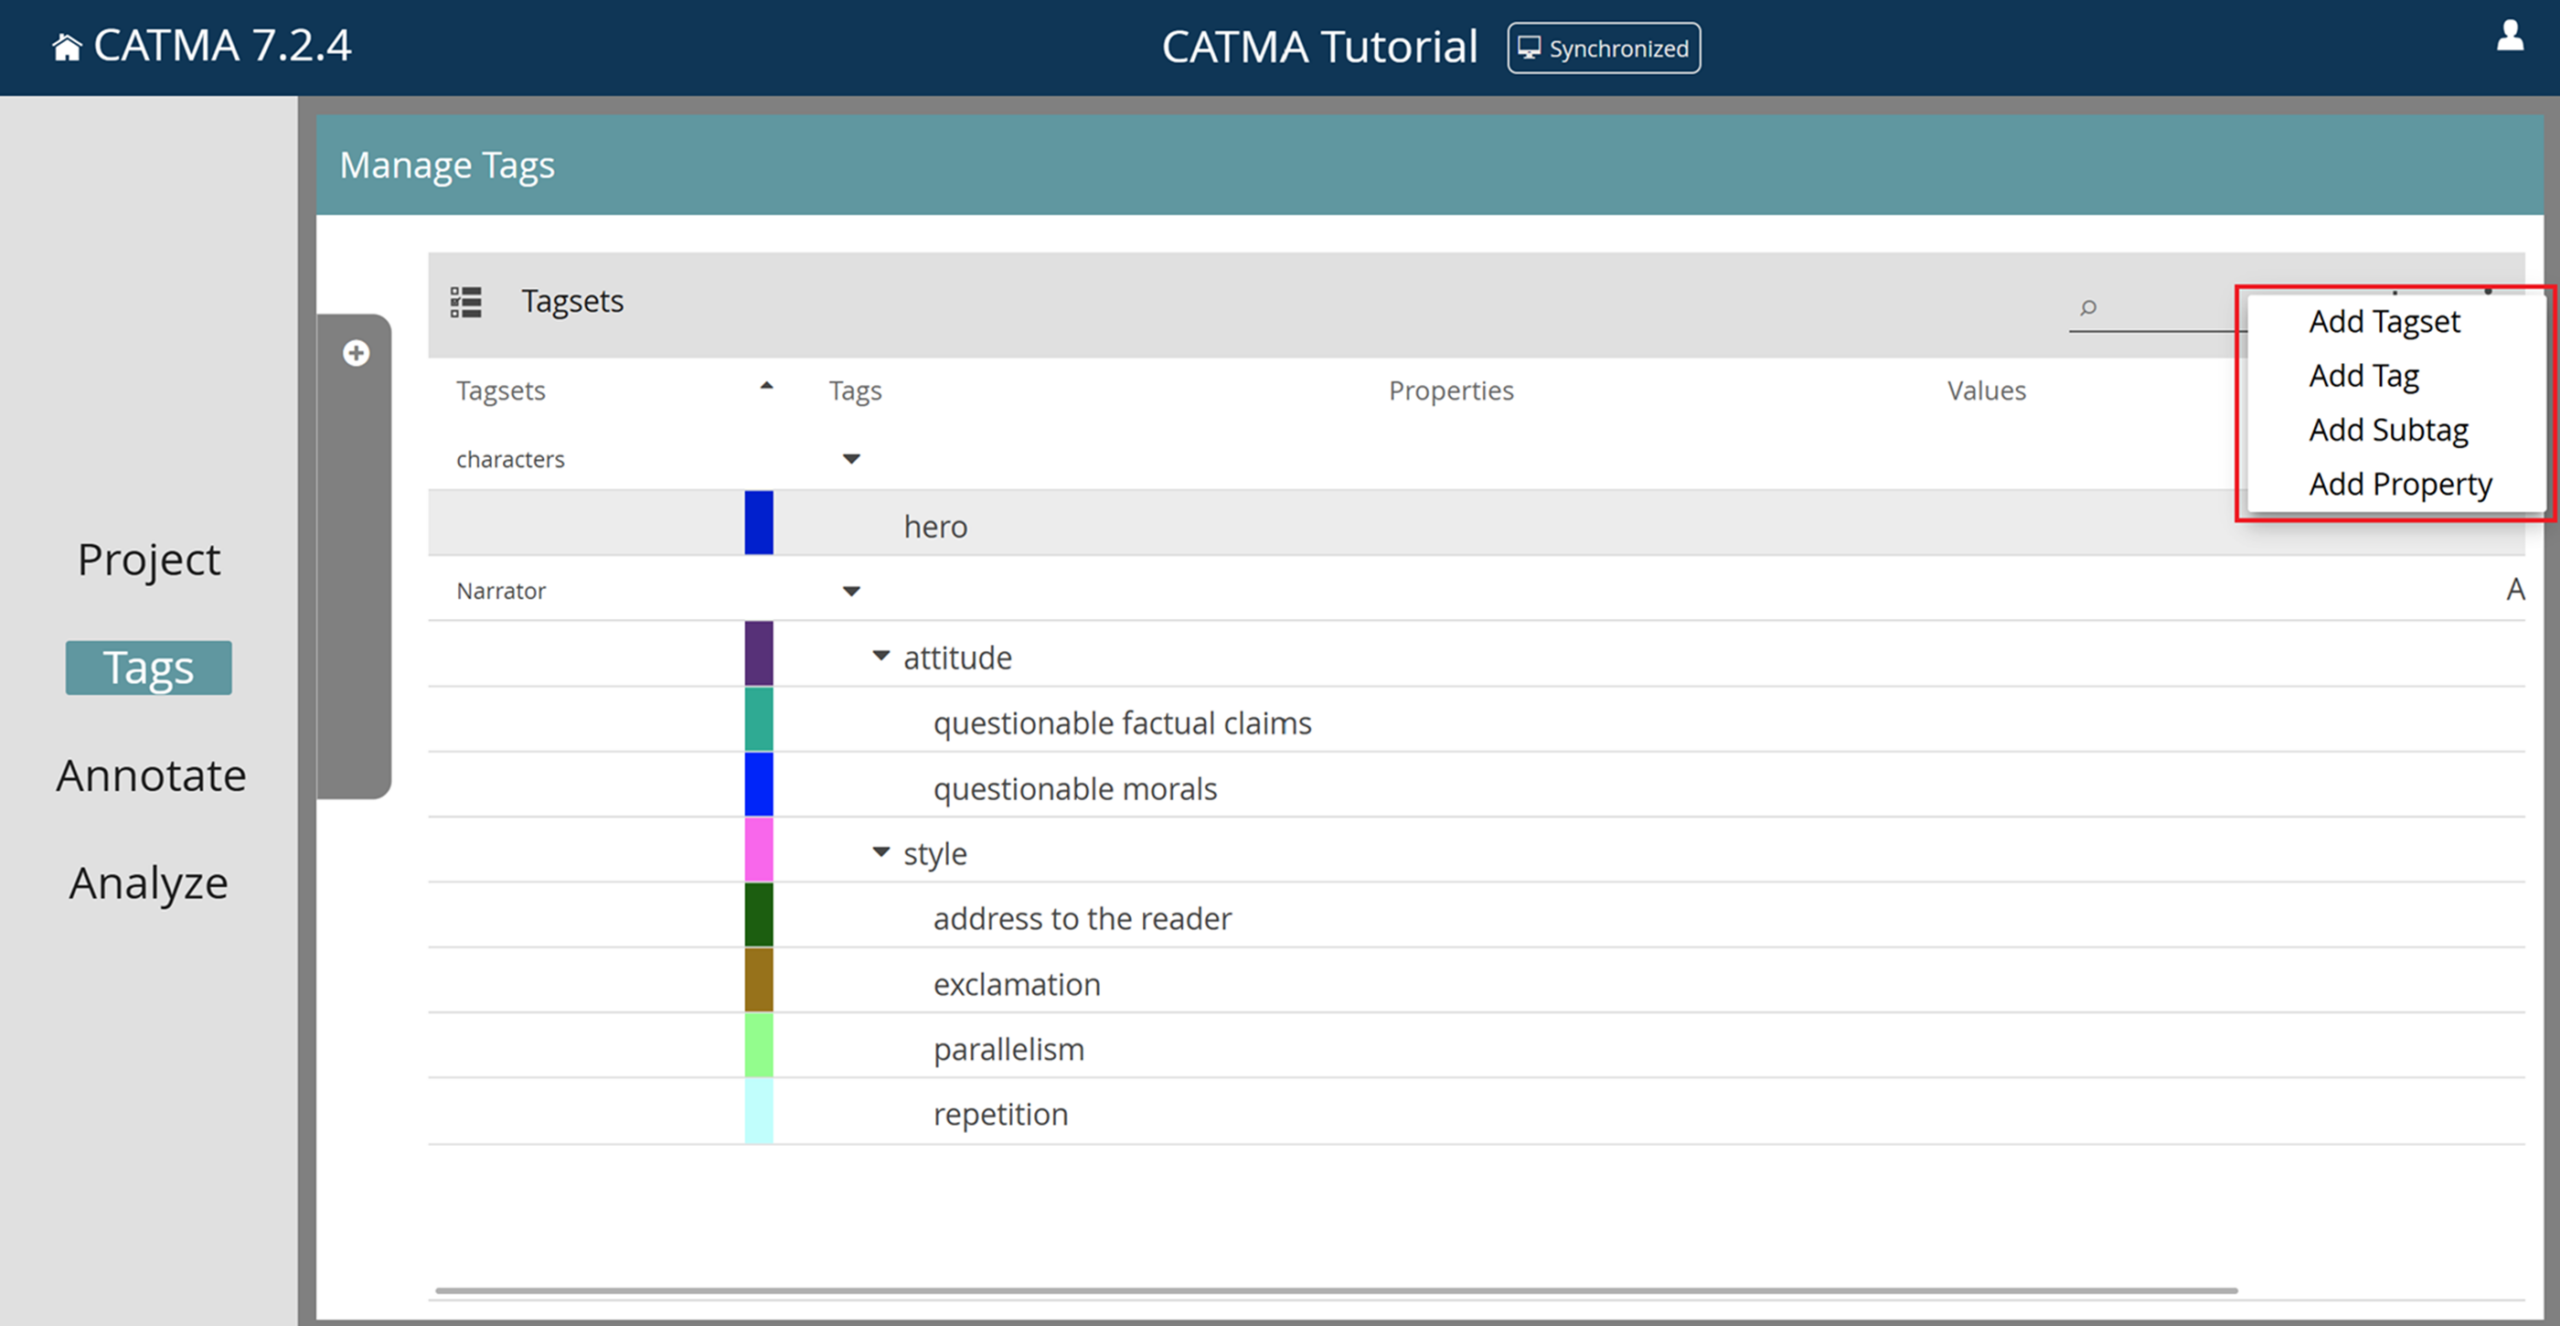
If your tagsets already contain tags, these can be displayed by expanding the tagsets via the small, right-facing arrow in the Tags column. The same applies to Properties and their Values, if available.
You also have the option of sorting the tagsets and their tags alphabetically (ascending or descending) by clicking on column heading Tagsets.
Add Tags, Properties and Values
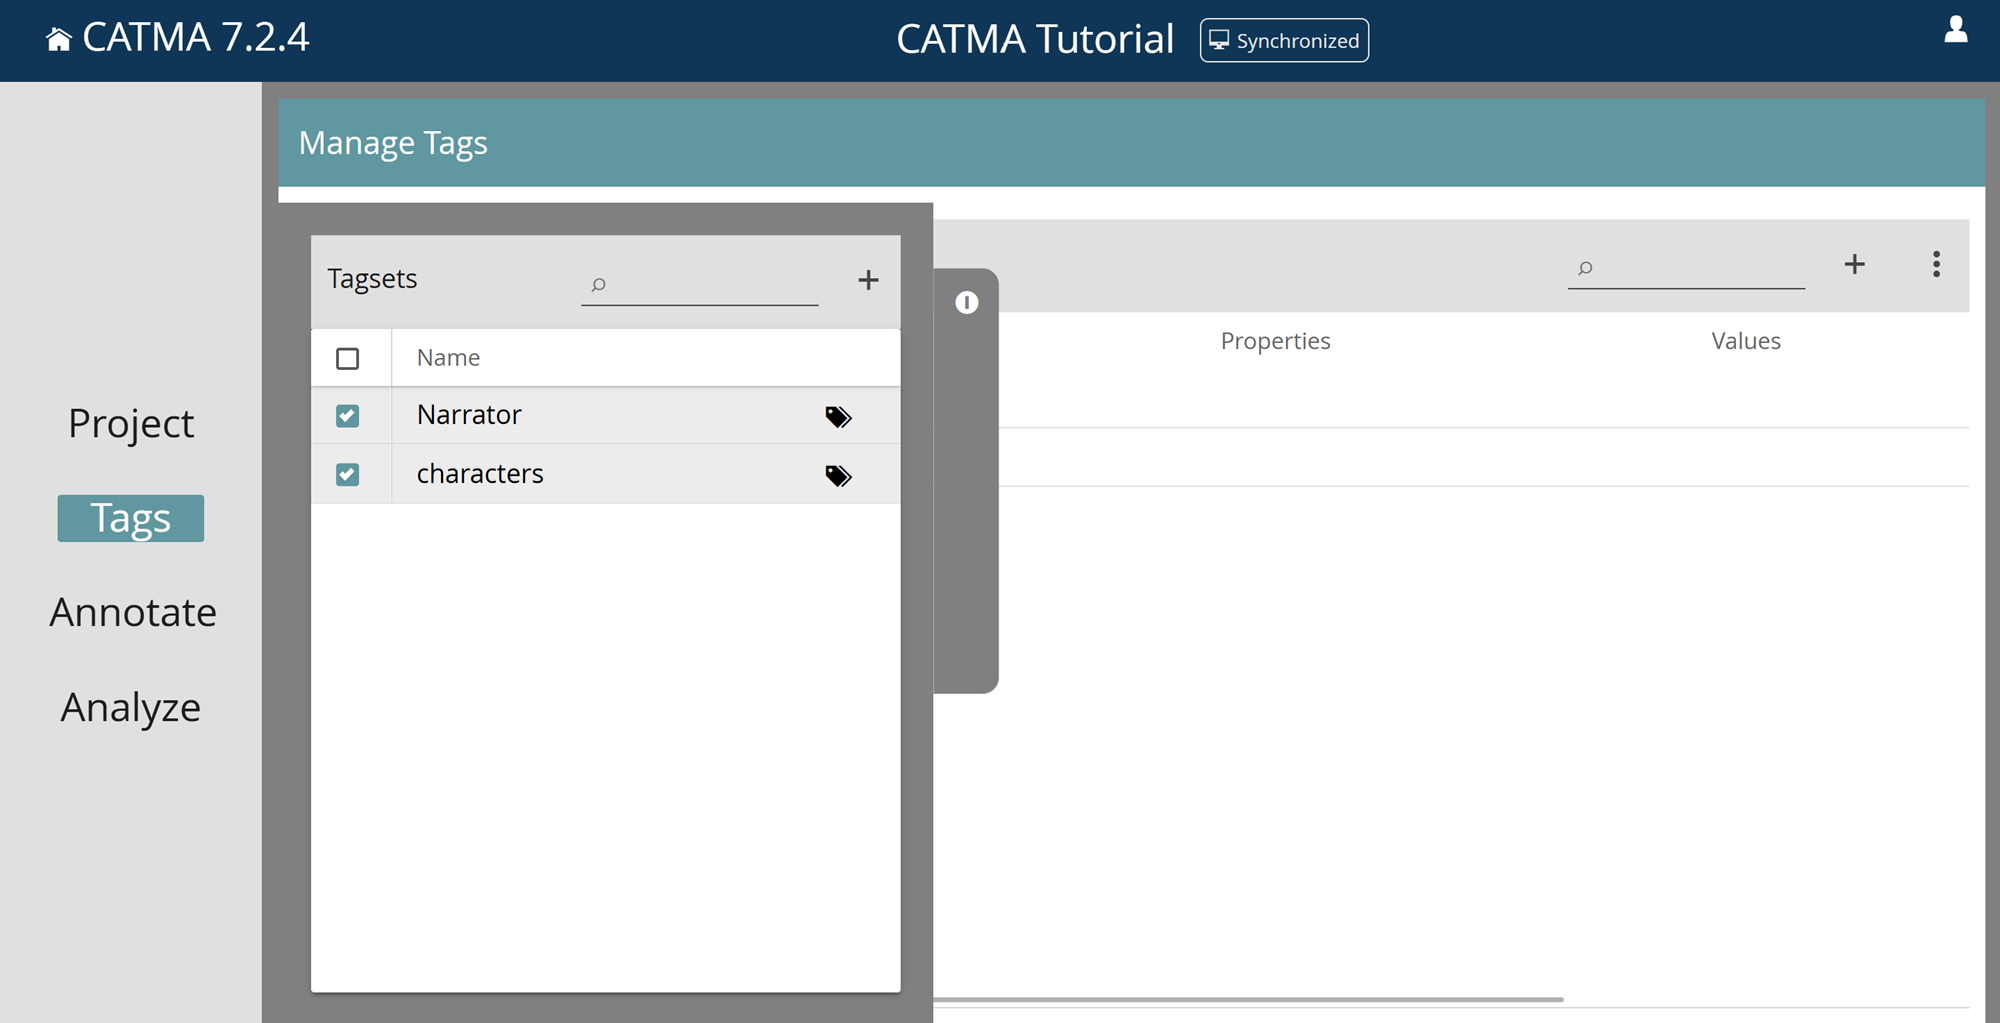
If you want to add a new tag to a tagset, select the tagset, click the plus icon at the top right of the table and select “Add Tag”. In the pop-up dialog, enter a tag name and optionally edit the tag color that was randomly selected.
You have the possibility to also add properties for the tag that you’re creating. Properties are a means to further qualify an annotation made with a tag. To add a property, type a name into the box provided and click “Add Property”. If you want to, you can then add proposed values for the new property. To do this, type in the values in the Proposed Values box. You can type in several values separated by commas. Later, if someone annotates a piece of text with this tag, they will automatically be prompted to set a value for each defined property, with the ability to select one of the proposed values or to enter their own, ad-hoc value.
When you’re done, click “Add Tag”. The new tag is now displayed in the tagset list. To display properties and values you might have added, further unfold the tagset via the arrows in the relevant columns.
To add a subtag – i.e., a tag that is a child of another tag in the tag hierarchy, select a tag in the table, click the plus icon, select “Add Subtag” and proceed in the same way as for adding tags.
You can also use the plus icon to add new tagsets or to add subtags or properties with the same name to a number of tags. (For the latter option, first select several tags for which you would like to create the relevant subtag or property.)
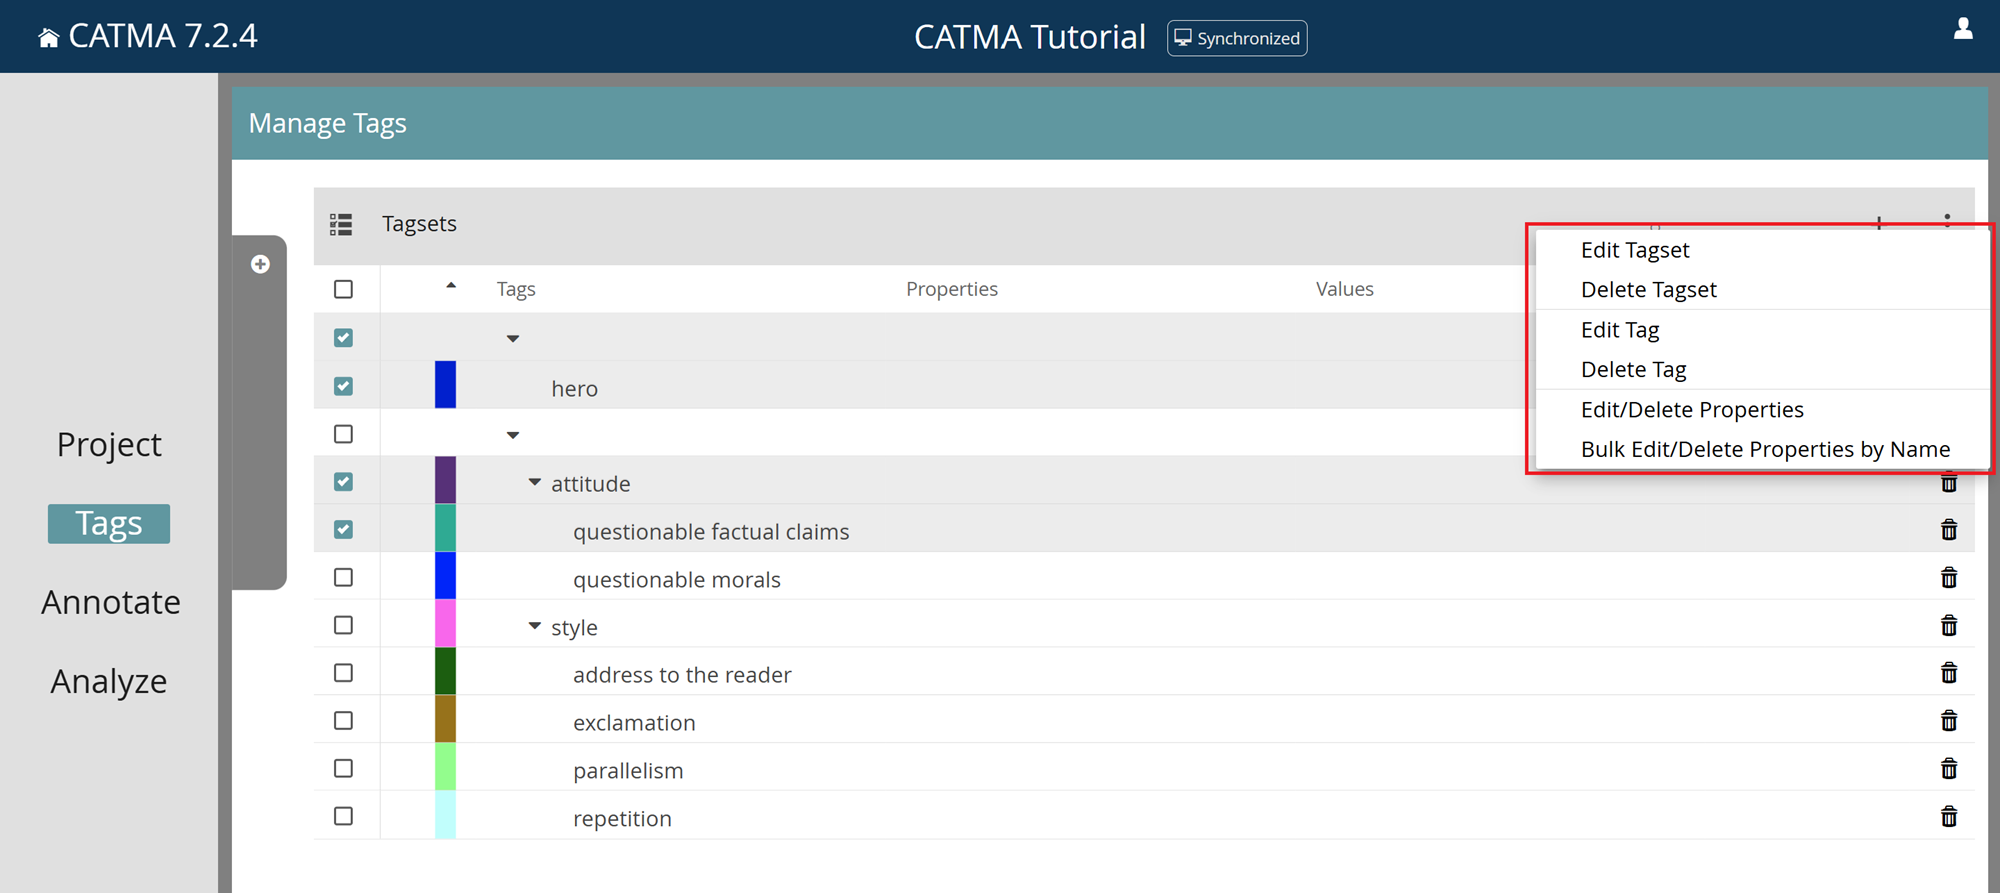
Edit or Delete Tagsets, Tags or Properties
To edit or delete tagsets, tags or properties, make a selection in the table, click the three-dot menu and choose the relevant option. Deletions can also be performed via the bin icons. Deletions can also be performed via the bin icons. Be aware that if you delete a tagset or a tag, all associated annotations will be deleted too. If you delete a property, the associated annotations will be updated to remove any values that were set for that property.
If you have created many properties with the same name, you have the option to edit or delete them all at the same time, as well as being able to update the associated annotations. To do so, select the relevant properties and choose “Bulk Edit/Delete Properties by Name” from the three-dot menu.
Please note that, for the Assistant role, the ability to edit or delete tagsets depends on who is set as being responsible for the tagset. Similarly, Assistants can only edit or delete tags or properties if they created them themselves.
Annotate Module
Enter the Annotate Module
Once your project contains at least one document, annotation collection and tagset, you can start to annotate a document in CATMA’s Annotate module.
To enter the Annotate module, either navigate there via the side menu or double-click a document or an annotation collection in the Project module.
Note that when you enter the Annotate module via the side menu for the first time after opening a project, you will find the gray filter drawer open with no document selected yet and all available tagsets pre-selected. Once you choose a document from the list, the drawer will automatically close and the selected text will be displayed.
If, however, you enter the module by double-clicking on a document or an annotation collection in the Project module, you’ll find the filter drawer closed and the selected/associated text already displayed.
Interface and Layout
The Annotate module has a tabbed interface: only one document can be displayed at a time, but you can open new tabs with different documents by clicking the plus icon in the top-right corner.
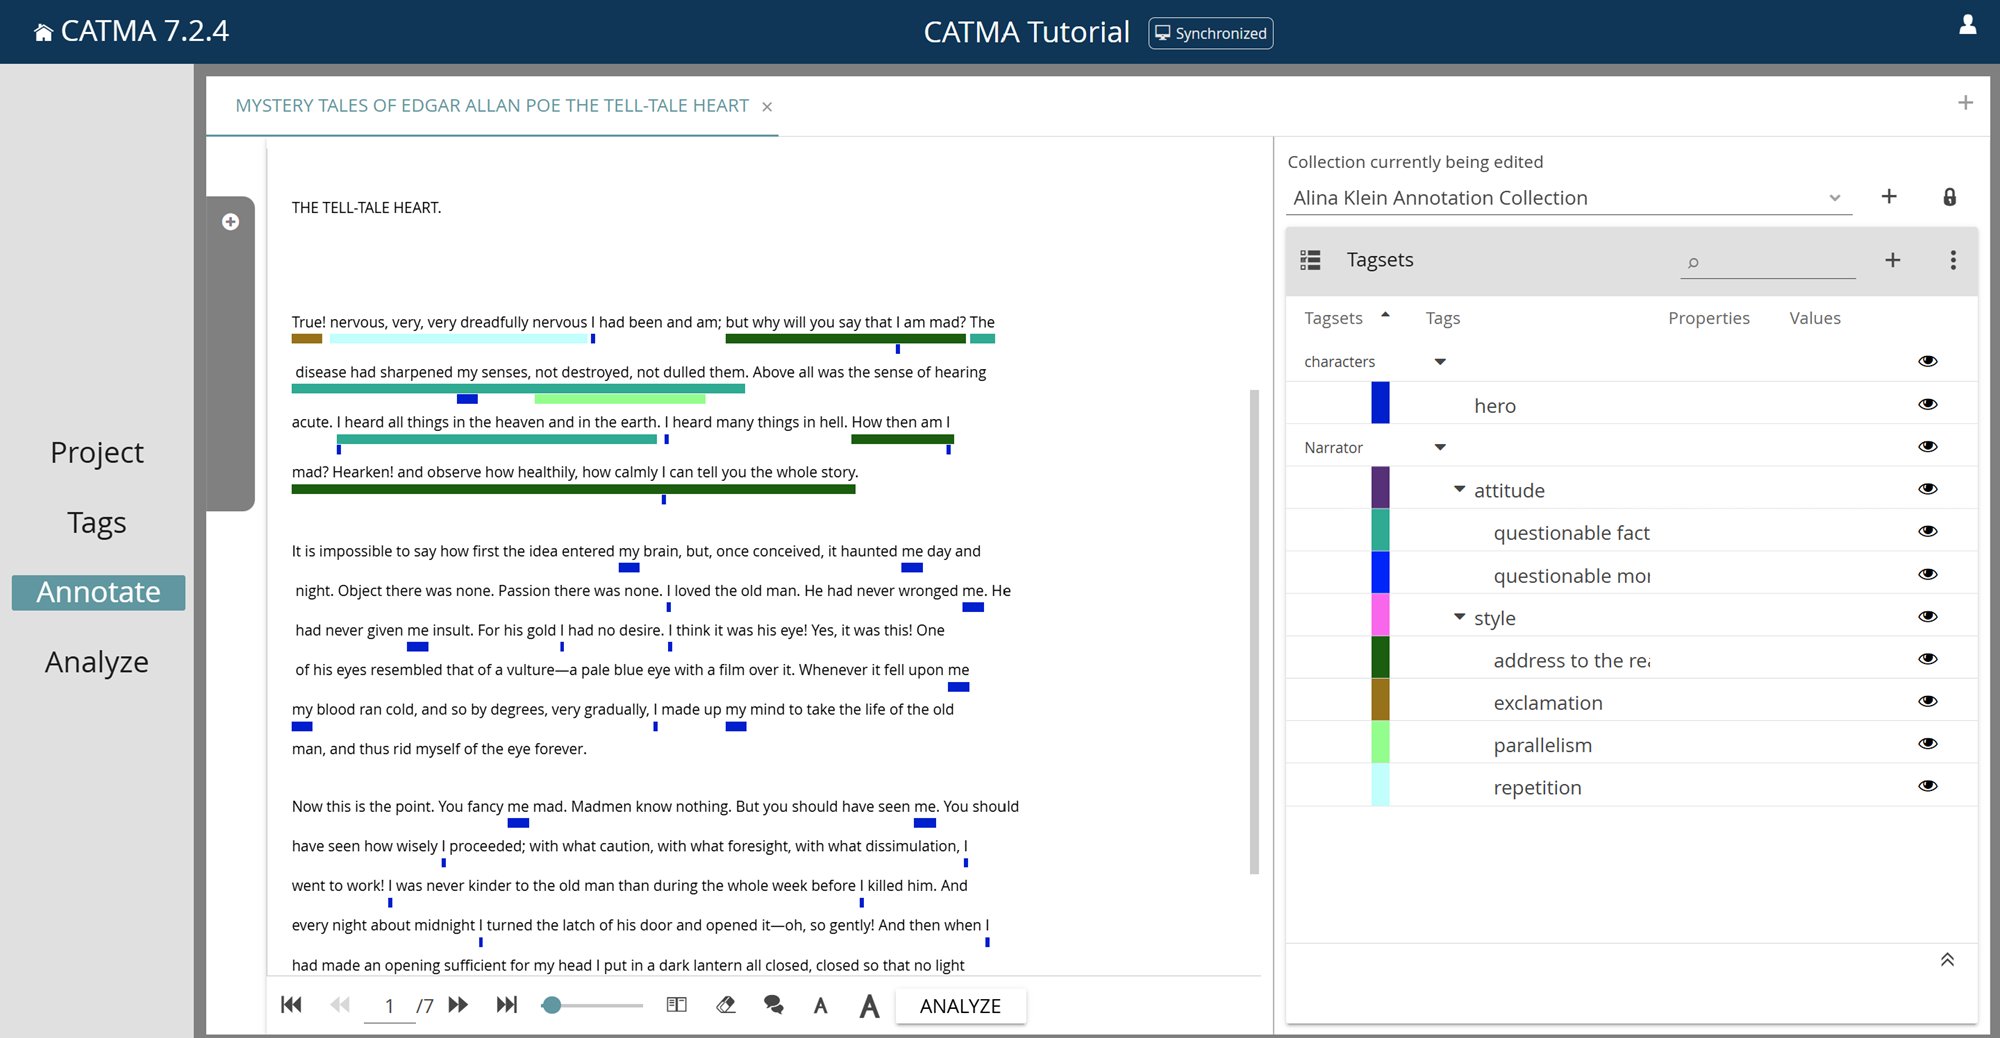
Within each document tab, the view is split into two columns. The left-hand column contains the text. Below the text you will find a number of controls for pagination, page size and font size, among others (some controls will reveal their purpose with a tooltip when you hover over them with your mouse cursor). The right-hand column contains a drop-down menu for the Collection currently being edited (the collection in which new annotations will be stored), along with buttons to create new collections and to toggle the visibility of collections according to responsibility. Below this you can see the Tagsets table, which functions very similarly to the one in the Tags module, but does not offer all of the same functionality. Below the Tagsets table there is a panel for the selected annotations, which is collapsed by default (explained below in View Information About Annotations). You can control the width of the columns, i.e. how much horizontal space each of them occupies, by clicking and dragging the vertical separator between them.
Automatic Collection Selection / Tagset and Tag Visibility
Once a document has been selected, if there is exactly one associated annotation collection for which you are responsible, then this collection will automatically be set as the one in which new annotations will be stored (the Collection currently being edited). If you are responsible for multiple annotation collections, you must select one of them manually. Collections that you are not responsible for are not displayed by default, so that you don’t accidentally use someone else’s. In group projects, each annotator usually has one collection for each document.
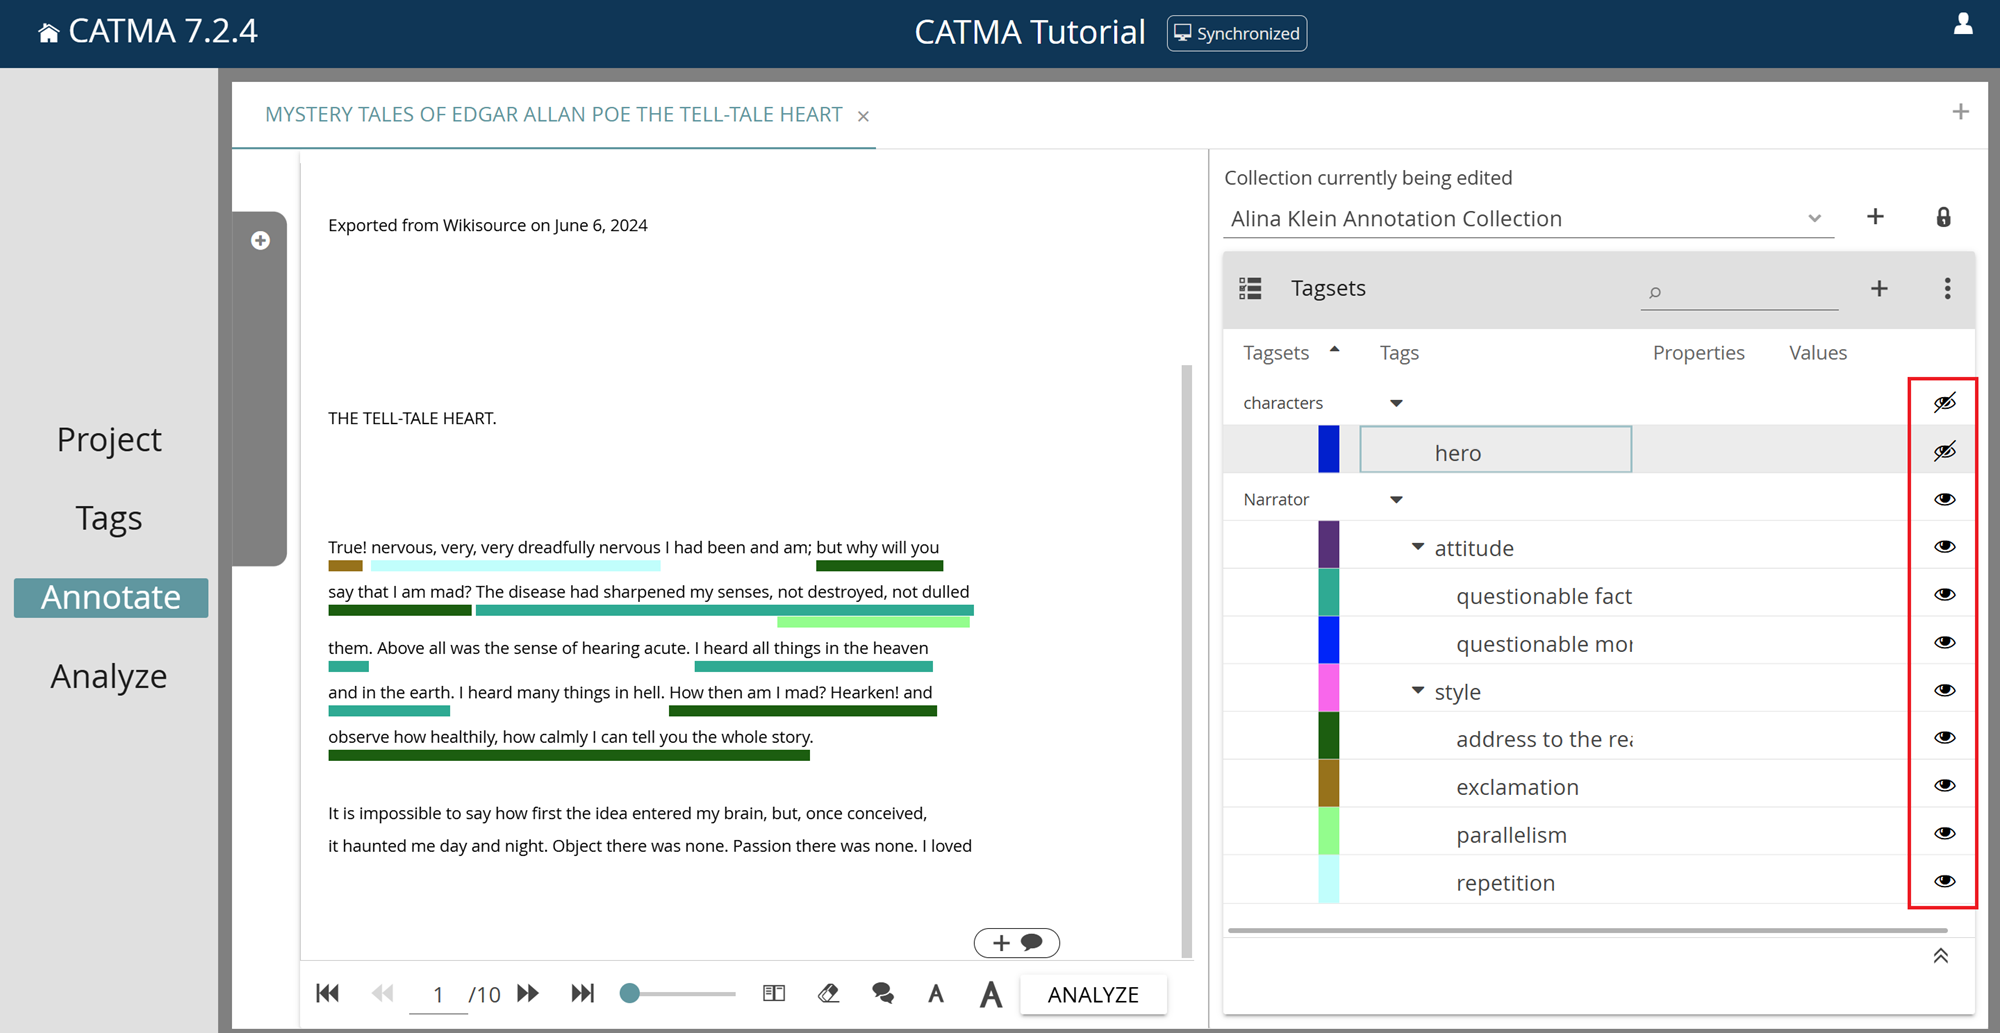
Take note of the rightmost column in the Tagsets table. This column contains eye icons at both the tagset and tag levels. These icons allow you to control the visibility of annotations in the text according to their tag. You can toggle the visibility for individual tags, or for entire tagsets, by clicking on the eye icon at the appropriate level.
Once a document has been selected, if there are multiple tagsets, CATMA automatically only sets one of them to be visible. This behavior is related to the potential performance implications of displaying a very large number of annotations, as some tagsets and their associated annotations may stem from automated pre-processing routines, such as part-of-speech tagging. CATMA tries to choose a tagset based on the annotations present in the Collection currently being edited, if set, otherwise it chooses the first tagset from the list in the filter drawer.
Set Filters
Open the gray filter drawer (by clicking on the gray latch) at any time to adjust your filters, i.e., to switch to a different document or to adjust the selection of tagsets.
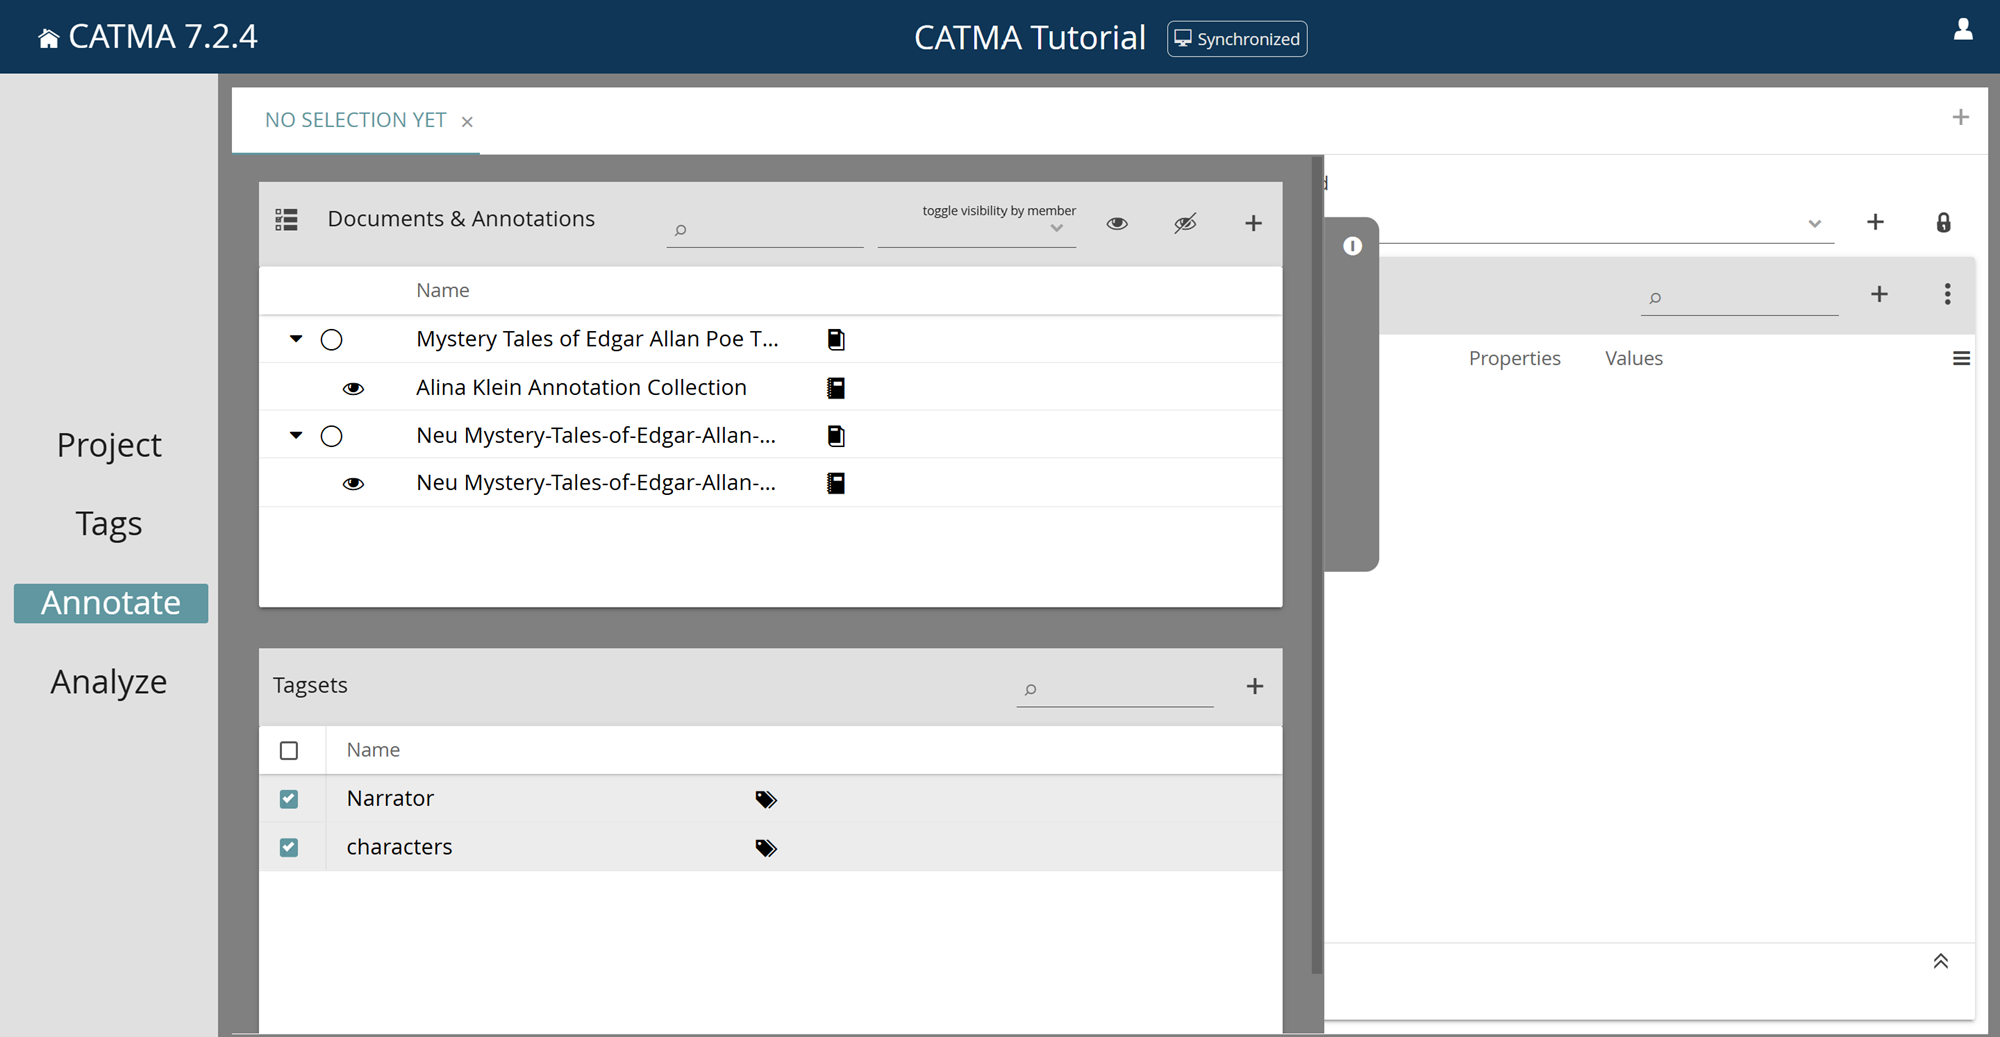
Take note of the leftmost column in the Documents & Annotations tile. This column contains eye icons at the annotation collection level. These icons allow you to control the visibility of annotations, like in the Tagsets table mentioned above, except that here the visibility is controlled according to the collection. In other words, you can hide or show all annotations contained in particular collections (which, as mentioned before, usually correspond to particular annotators). You also have the option of toggling the visibility of all collections belonging to particular members, or all members belonging to a particular group. To do this, select a member or group from the drop-down menu at the top right of the Documents & Annotations tile and use the adjacent visibility buttons to toggle the visibility of all related collections at once.
Annotate
Before you start working on annotations, make sure that the appropriate Collection currently being edited has been selected. If you do not have a collection for the selected document yet, you will need to create one. You can use the gray filter drawer to do so: open it by clicking on the gray latch, then click the plus icon in the top-right corner of the Documents & Annotations tile, type in a name and confirm.
Once a document, the Collection currently being edited, and at least one tagset have been selected, you can now start annotating your text.
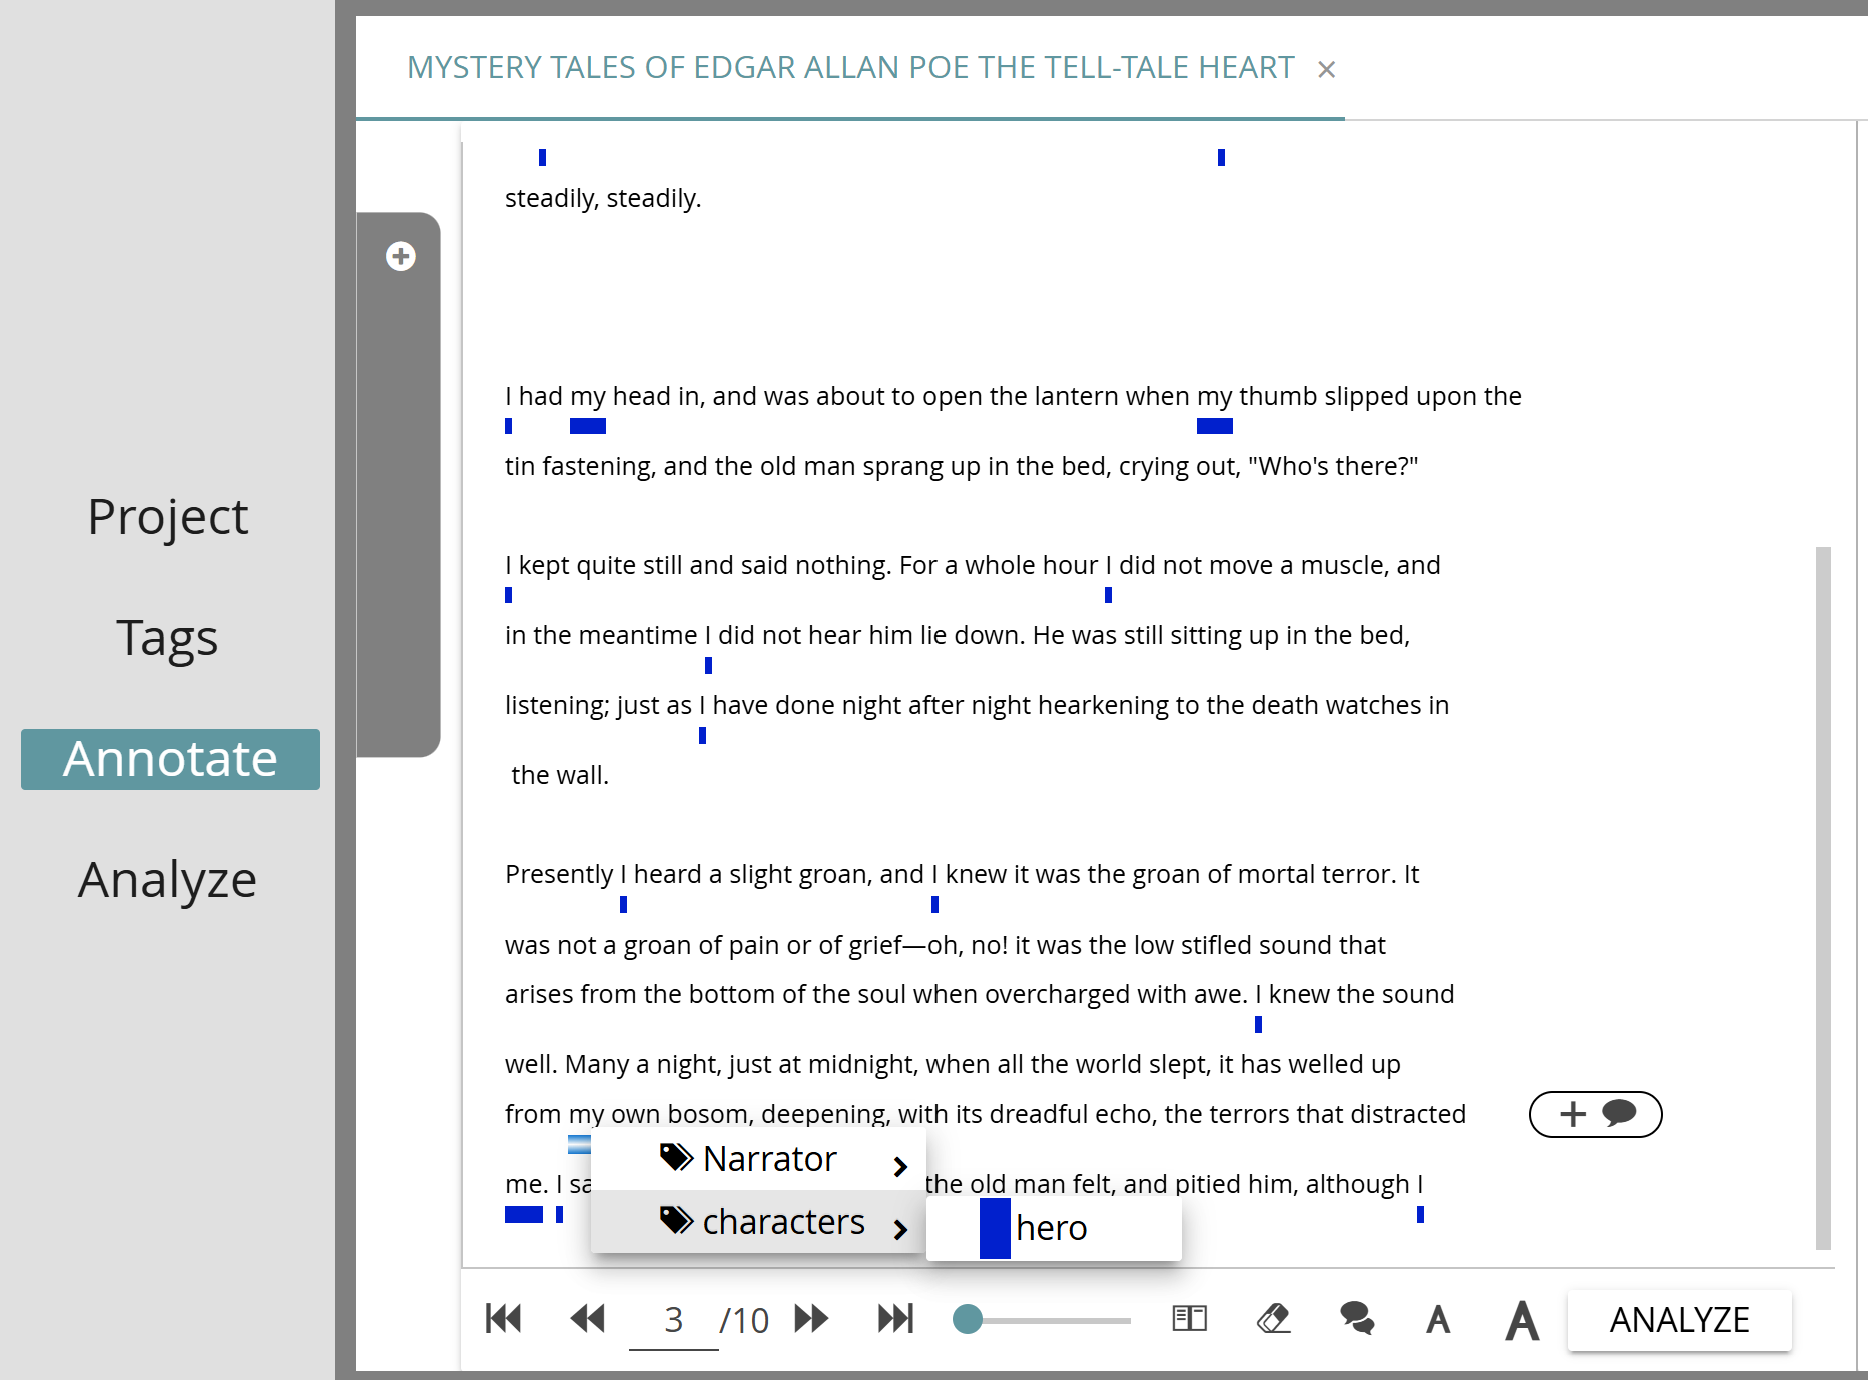
Use the mouse cursor to select and highlight a passage from the text on the left. One way to annotate the selected text is by right-clicking on it. A context menu displaying the selected tagsets will appear. By hovering over a tagset, it will be expanded to show the available tags, which can then be further expanded if there are subtags. Select a tag from the menu via left-click. If the selected tag does not have any properties, the selected text passage is immediately underlined in the color of the chosen tag and the annotation is stored. If the selected tag does have properties, you will first see a pop-up dialog. You now have the option to add pre-defined or new custom property values to your annotation. Once done, click “OK” to close the dialog and store the annotation.
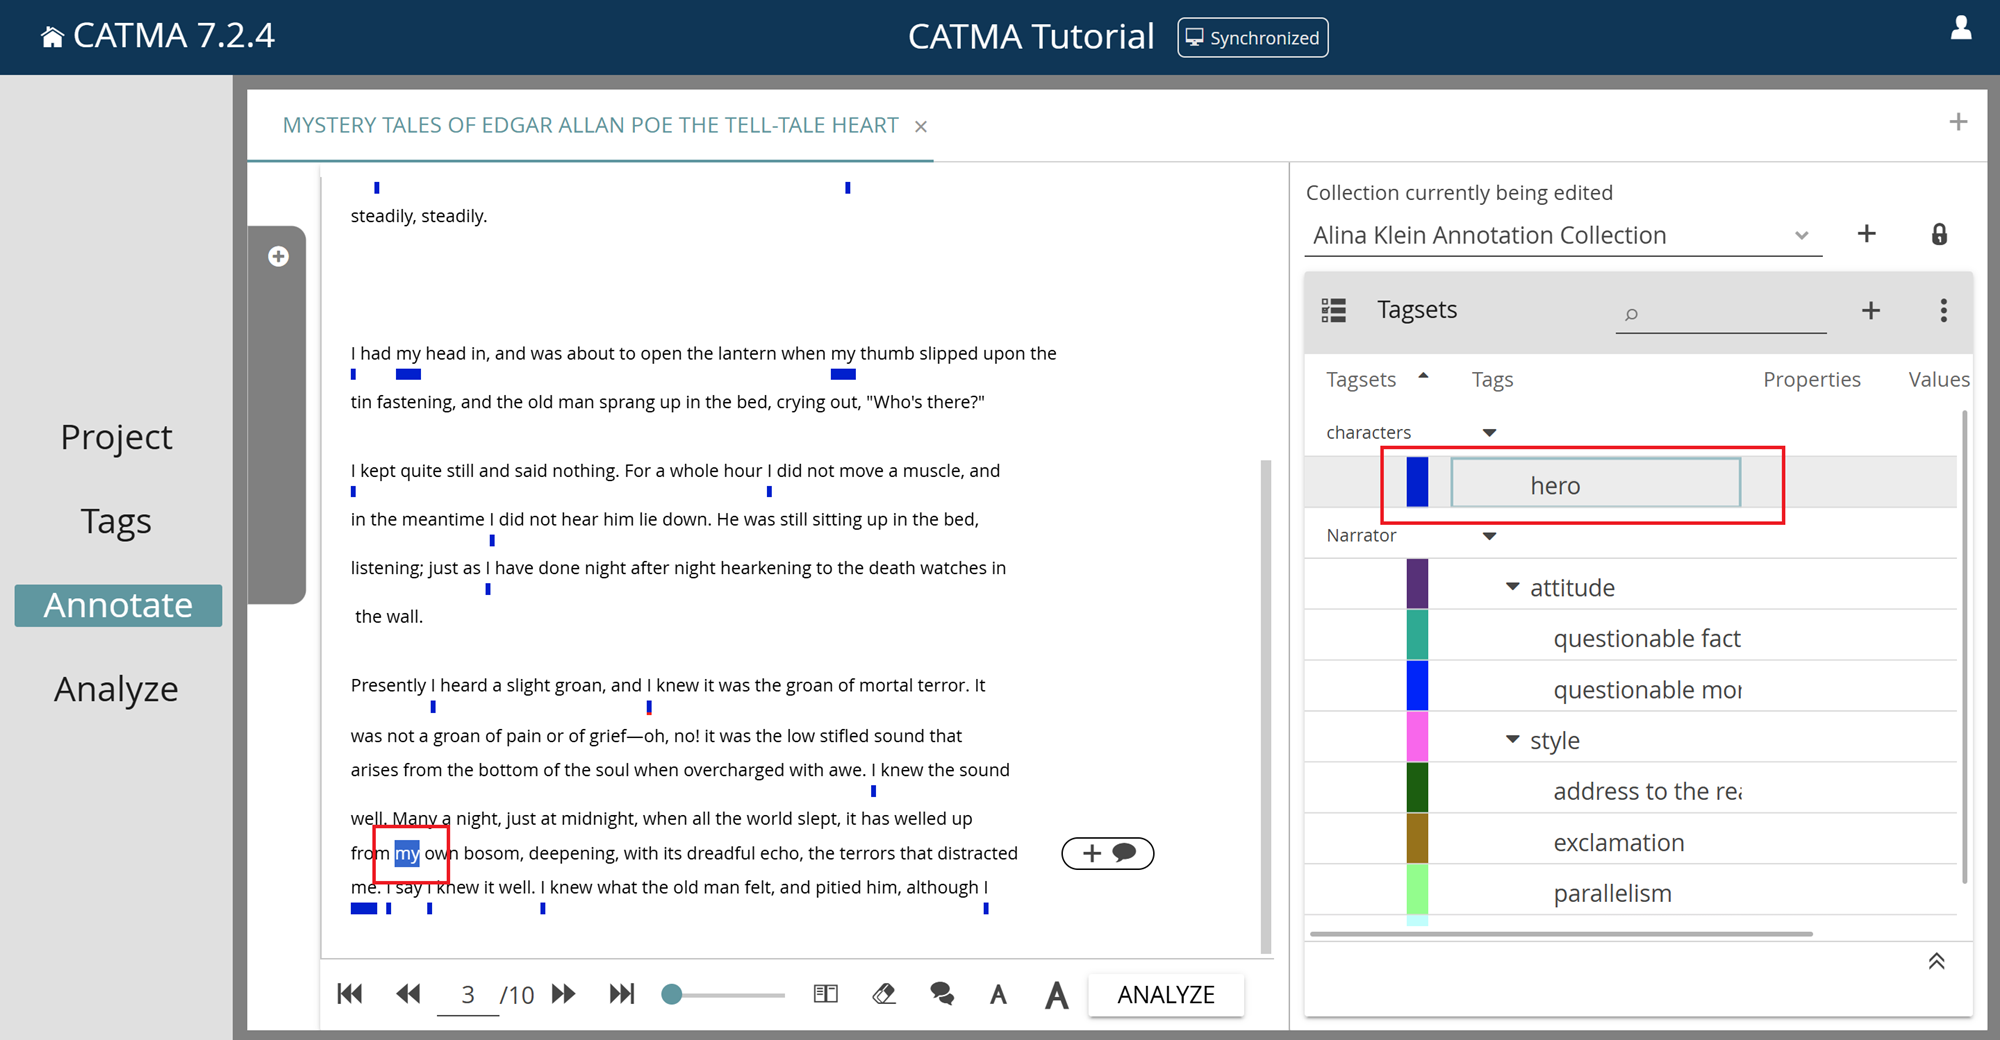
Another way to annotate, after selecting a passage of the text as above is to use the tagsets table on the right. Expand a tagset until you can see the tag that you want to use, then click the line of the tag. Just as described for the other annotation method above, depending on whether the tag you select has properties, you may encounter a pop-up dialog where you can then set property values before the annotation is stored.
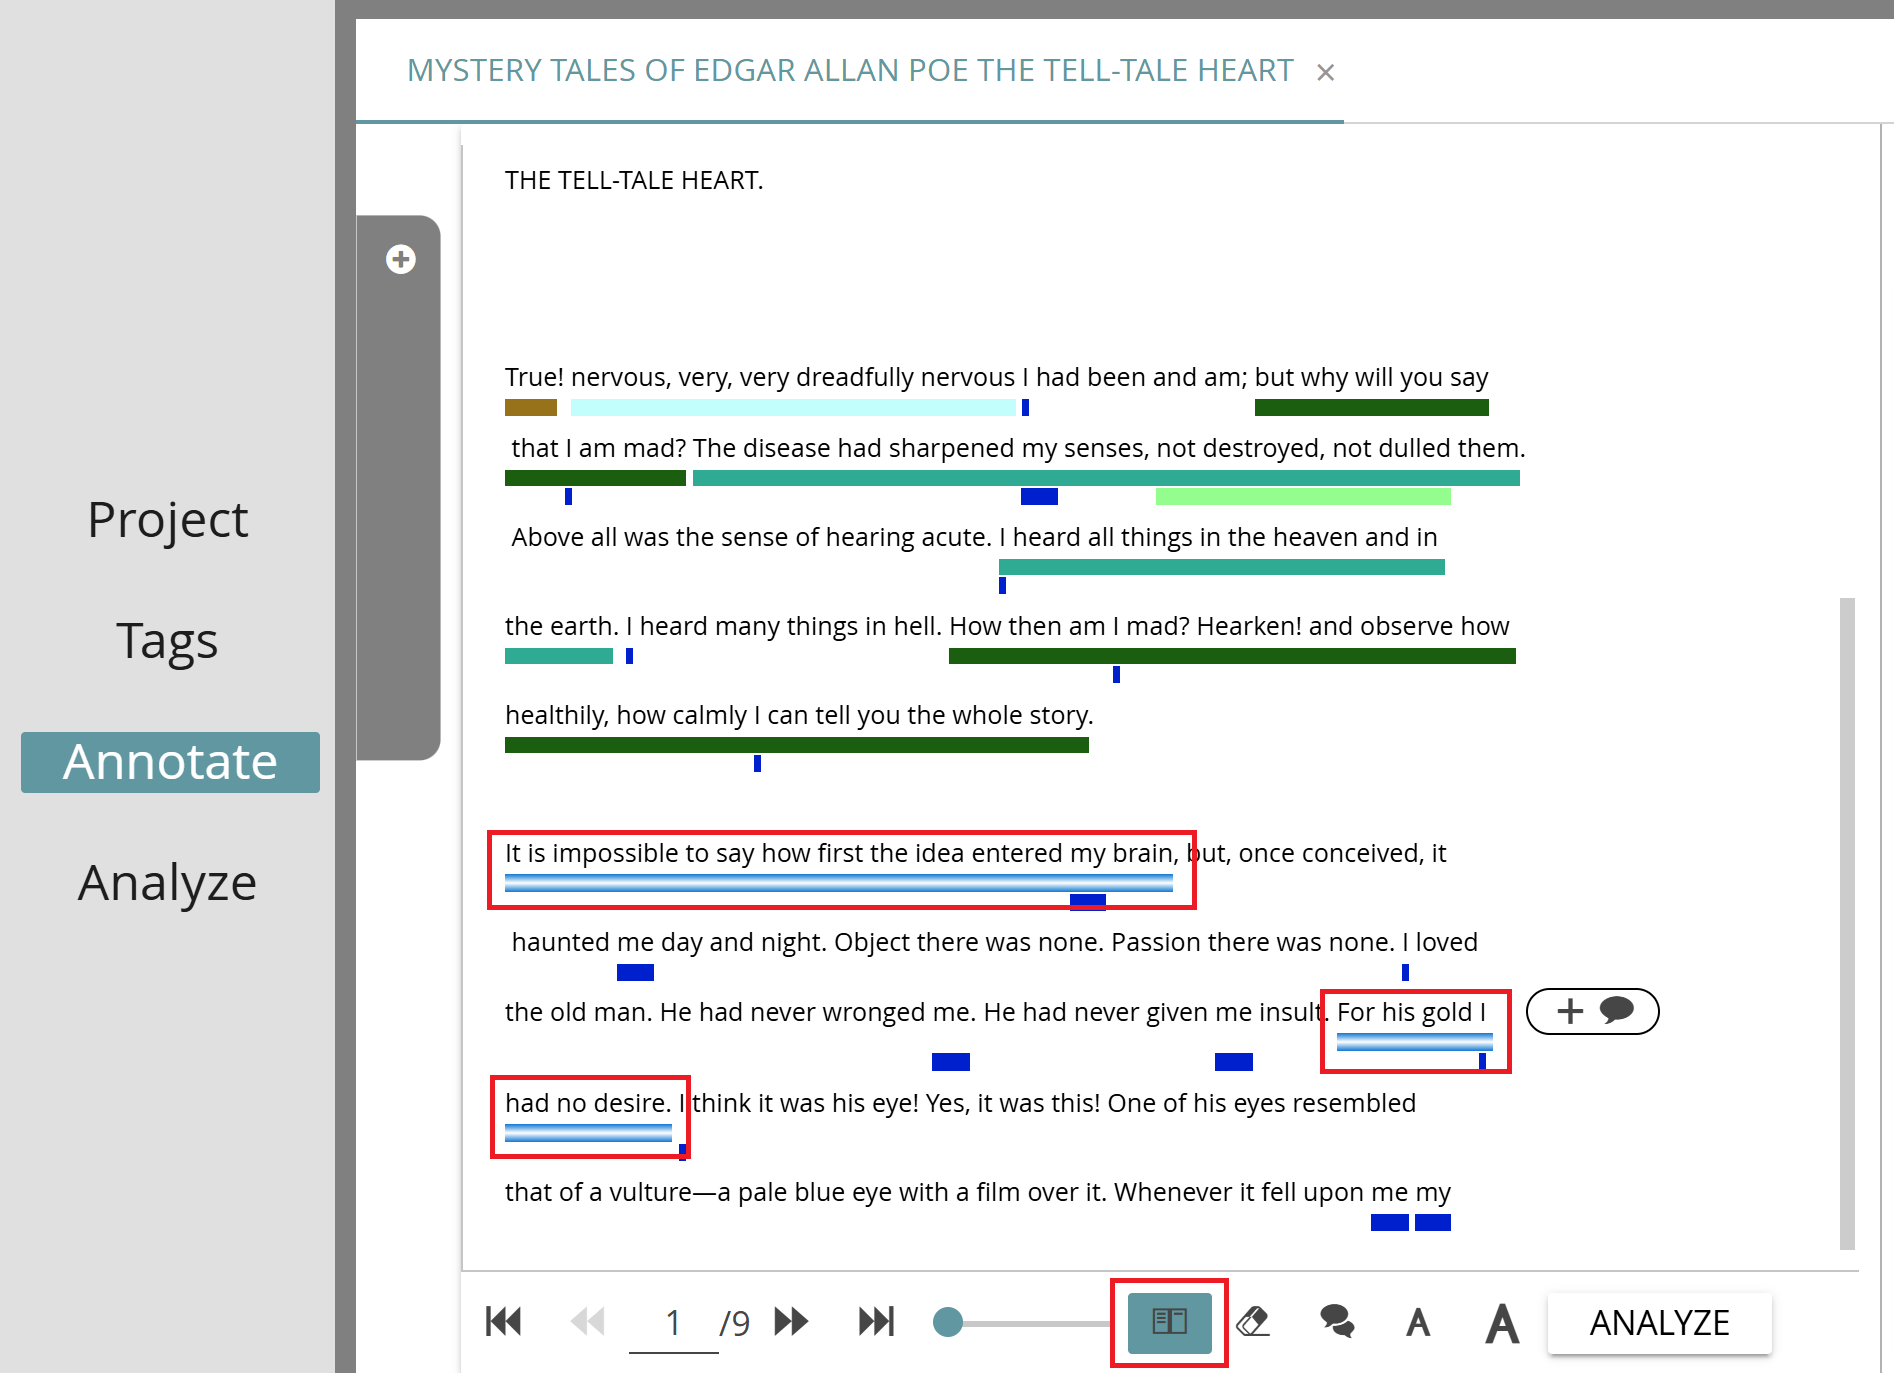
To create a discontinuous annotation, i.e., one that applies to multiple separate text passages, click the “Allow multiple discontinuous selections“ icon below the text, to the right of the page size slider. You can now select multiple passages from the text and then choose a tag as described above. When you’re done annotating discontinuously, simply click the icon again to turn off the option.
To customize your annotation view to your needs, you can adjust the font size and the virtual page size. The slider below the text determines how much text fits on a page; it is possible to either scroll all the text on a single page (slider set to 100) or to create smaller individual pages, which you can then flip through using the corresponding buttons to the left of the slider. (Note that high slider settings may cause performance degradation.) To change the font size in the document view, click on the small or large “A” icons.
Note that you can also create annotations semi-automatically! See KWIC Visualization to find out how.
View Information About Annotations
If you want to see more information about existing annotations, hover over the tag-colored underline beneath an annotated text passage. You’ll now see the tag path (i.e., where in which tagset the used tag is located), the collection that contains the annotation, the CATMA user who created it, and any properties and their values, all in a tooltip.
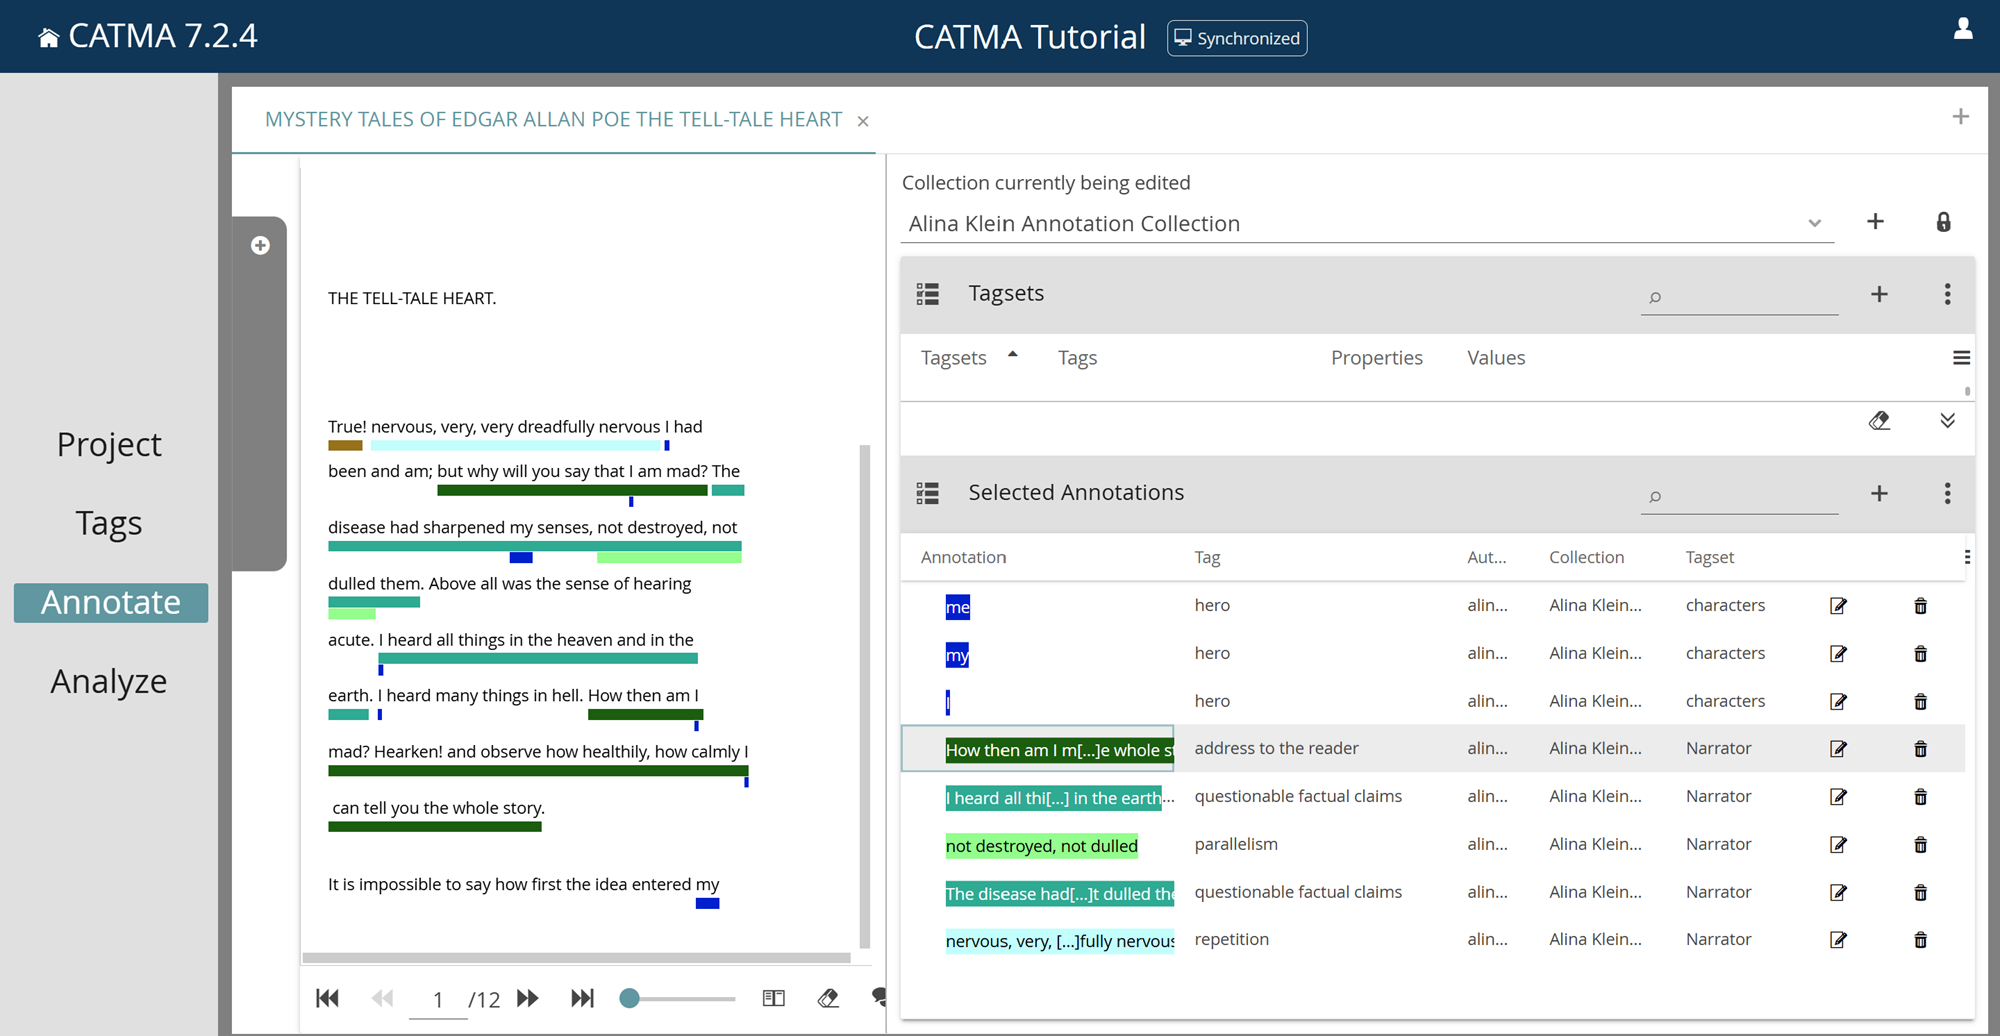
Instead of hovering you can also view information about annotations in a tabular format: click on the tag-colored underline, which will open the panel containing the Selected Annotations table, beneath the Tagsets table on the right. The annotation that you clicked will be added to this table. At the top right of the panel you will find buttons to clear the list of selected annotations and to collapse the panel.
Edit or Delete Annotations
If you want to edit or delete an annotation, first click on the tag-colored underline to add it to the Selected Annotations table, as described above. You can add multiple annotations to this table. To edit the property values of annotations, click on the pencil-and-paper icon in the second-last column of the corresponding row. To delete annotations, click on the bin icon in the last column.
Please note that, currently, the only aspect of annotations that can be edited is the property values. For example, it isn’t possible to modify the bounds of an annotation (to move an annotation in the text – to do that, you would need to delete and recreate it.)
You can also sort the selected annotations according to your wishes by clicking on the different column headings.
Comments
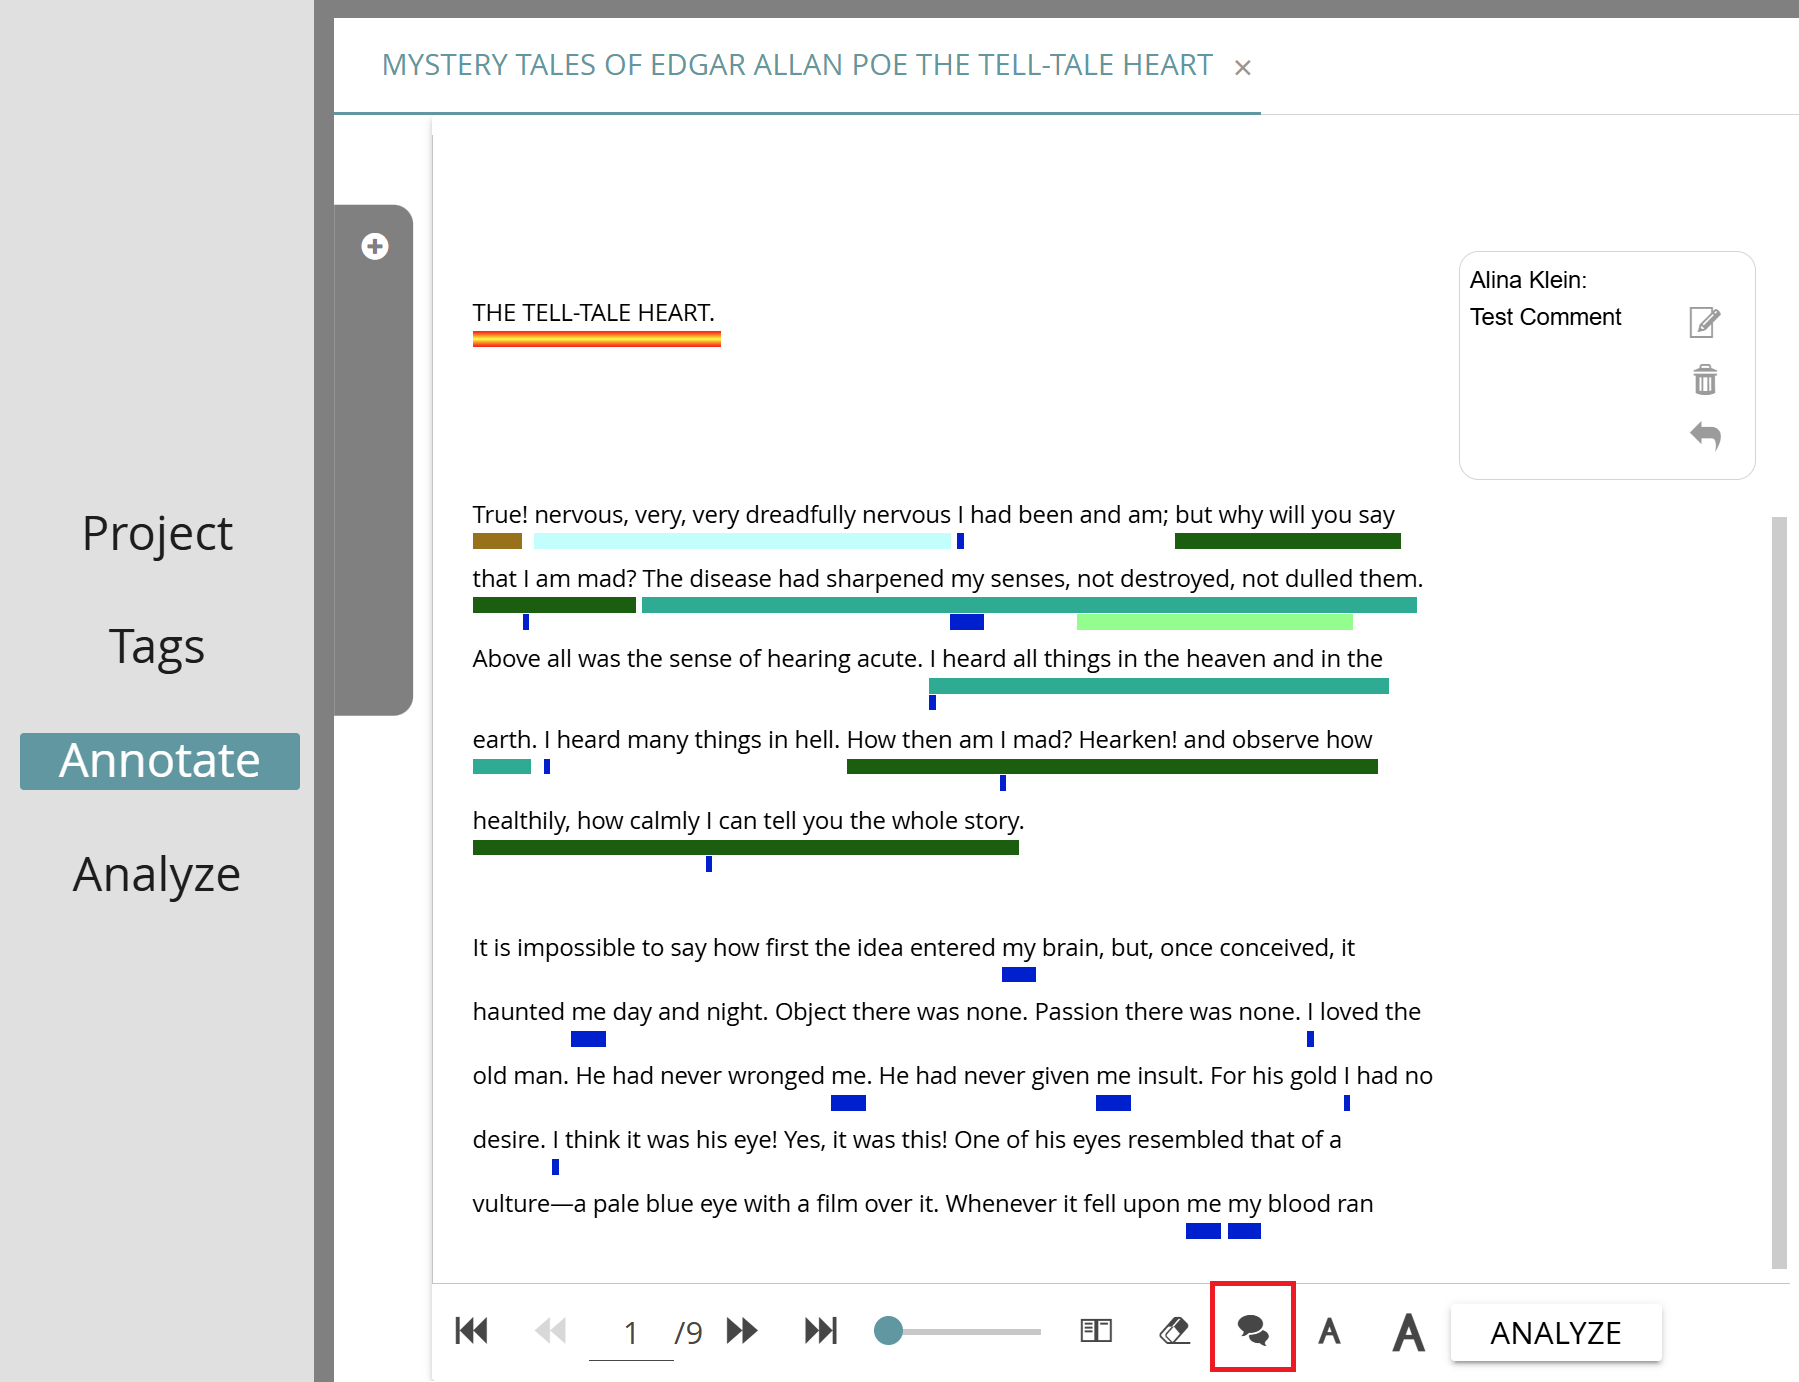
CATMA also has a collaborative commenting feature suited for open discussions. It works in real time, allows for replies, and the comments can be exported from the Analyze module. To use this feature, start as you would when annotating: select or highlight the word or text passage you wish to comment on. A button with a “+” and a speech bubble icon will appear in the margin to the right of the text. Click on this button to add your comment. Existing comments are displayed in the margin as well. Click on an existing comment to see which part of the text it relates to, and to reply to, edit, or delete it. While annotating, you can toggle comment visibility by clicking on the comment icon below the text. You can choose between live updates (the default), on, or off.
Analyze Module
Enter the Analyze Module
In the Analyze module, you can explore texts and annotations with queries and visualizations. To enter the Analyze module, you can either use the left-side menu or click the “Analyze” button below the text in the Annotate module.
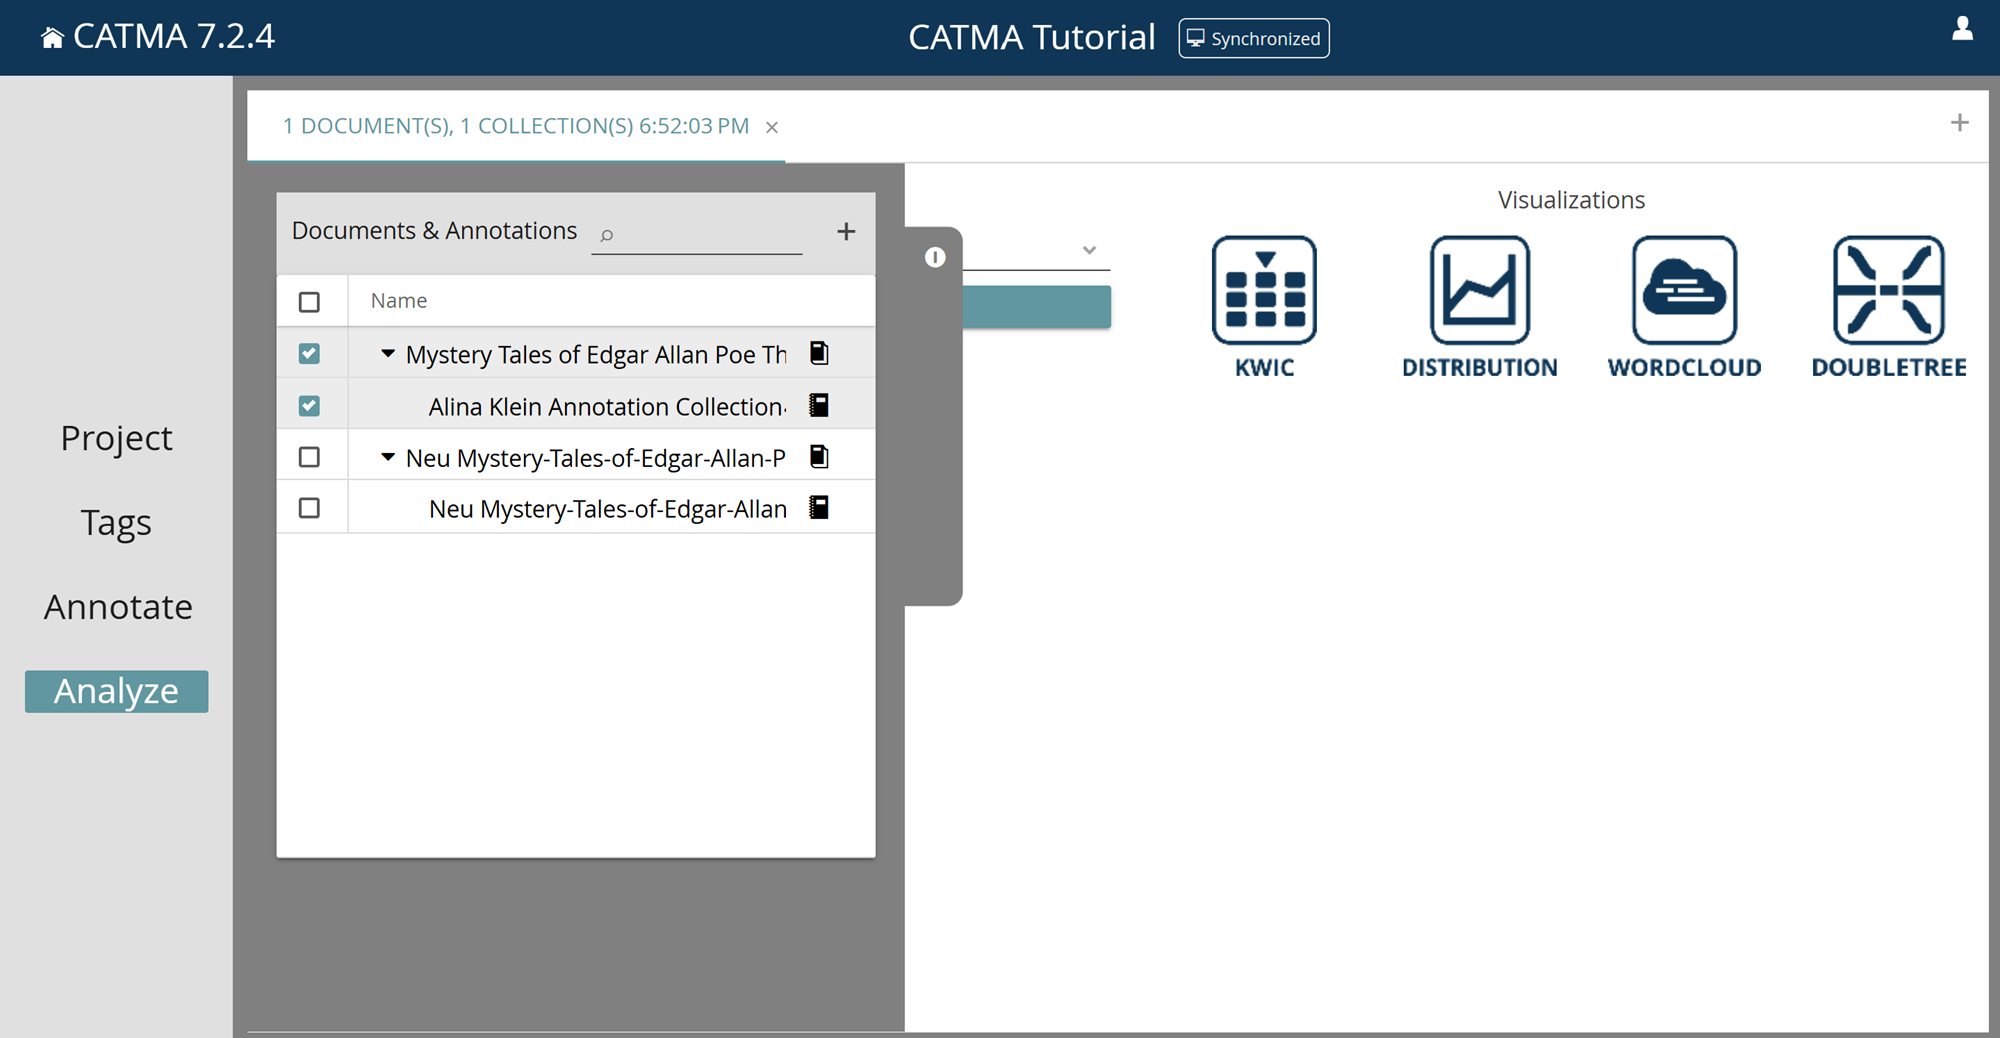
Note when you enter the Analyze module via the side menu for the first time after opening a project you will find the gray filter drawer open with no document or annotation collection selected yet. Select as many documents and/or annotation collections as you like by ticking the relevant boxes. Close the drawer by clicking on its latch on the right side.
If, however, you enter the Analyze module by clicking the “Analyze” button in the Annotate module, you’ll find the filter drawer closed and the document/collection(s) you’re currently working with in the Annotate module will already be selected.
Interface and Layout
Like the Annotate module, the Analyze module has a tabbed interface: you can open new tabs with different selections of documents and annotation collections by clicking the plus icon in the top-right corner. This allows you to have multiple analysis “sessions”, targeting different project resources, open in parallel.
Within each tab, the view is split into two columns. The left-hand column is for queries and their results, while the right-hand column is for visualizations.
Set Filters
Open the gray filter drawer (by clicking on the gray latch) at any time to adjust your filter, i.e., to select the documents and annotation collections to be considered/included when running queries (see below).
Queries
Queries allow you to explore, analyze and evaluate texts and their associated annotation data – to ask questions of your data. For this purpose, CATMA has its own Query Language. If you have ever run queries against a relational database using SQL, you will soon see that CATMA’s query language works in a similar way. If that all sounds foreign to you, don’t worry, you don’t need to be an expert to see results quickly.
Execute Queries
To execute a query on documents or annotation collections, you have three options: select a pre-defined query, use the Query Builder or type in a query directly.
Predefined Queries
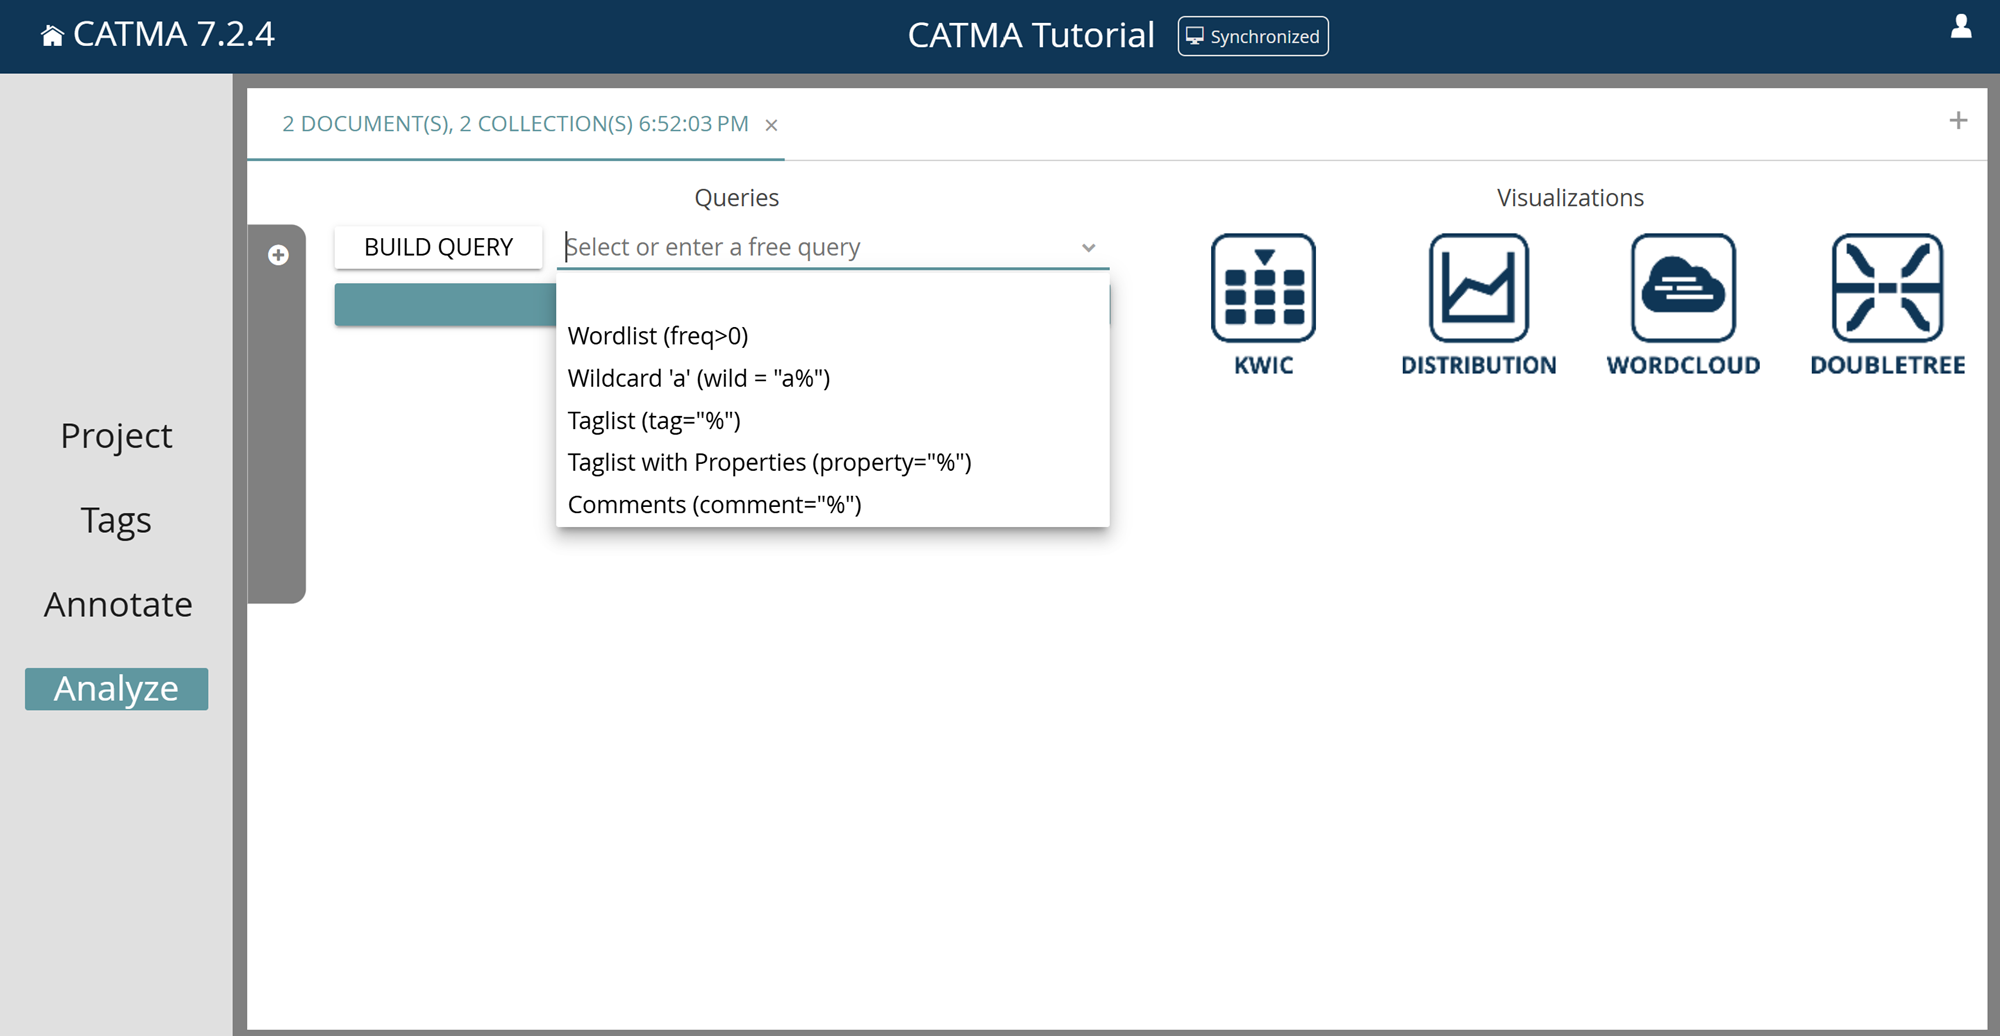
You can select one of the five available queries from the drop-down menu by clicking on the arrow to the right of the query field:
- the “Wordlist” query lists all the words of the analyzed document(s)
- the “Wildcard ‘a’” query lists all the words starting with the letter “a”
- the “Taglist” query lists all the text passages that have been annotated with any tag (in other words, it lists all the annotations in the analyzed collections) – by default, results are grouped by phrase, but they can alternatively be grouped by tag (see Explore Query Results below)
- the “Taglist with Properties” query lists all the text passages that have been annotated with tags that have any property (without further modification, this query delivers the same results as the “Taglist” query, but additionally includes property values)
- the “Comments” query lists all the text passages that have comments attached to them
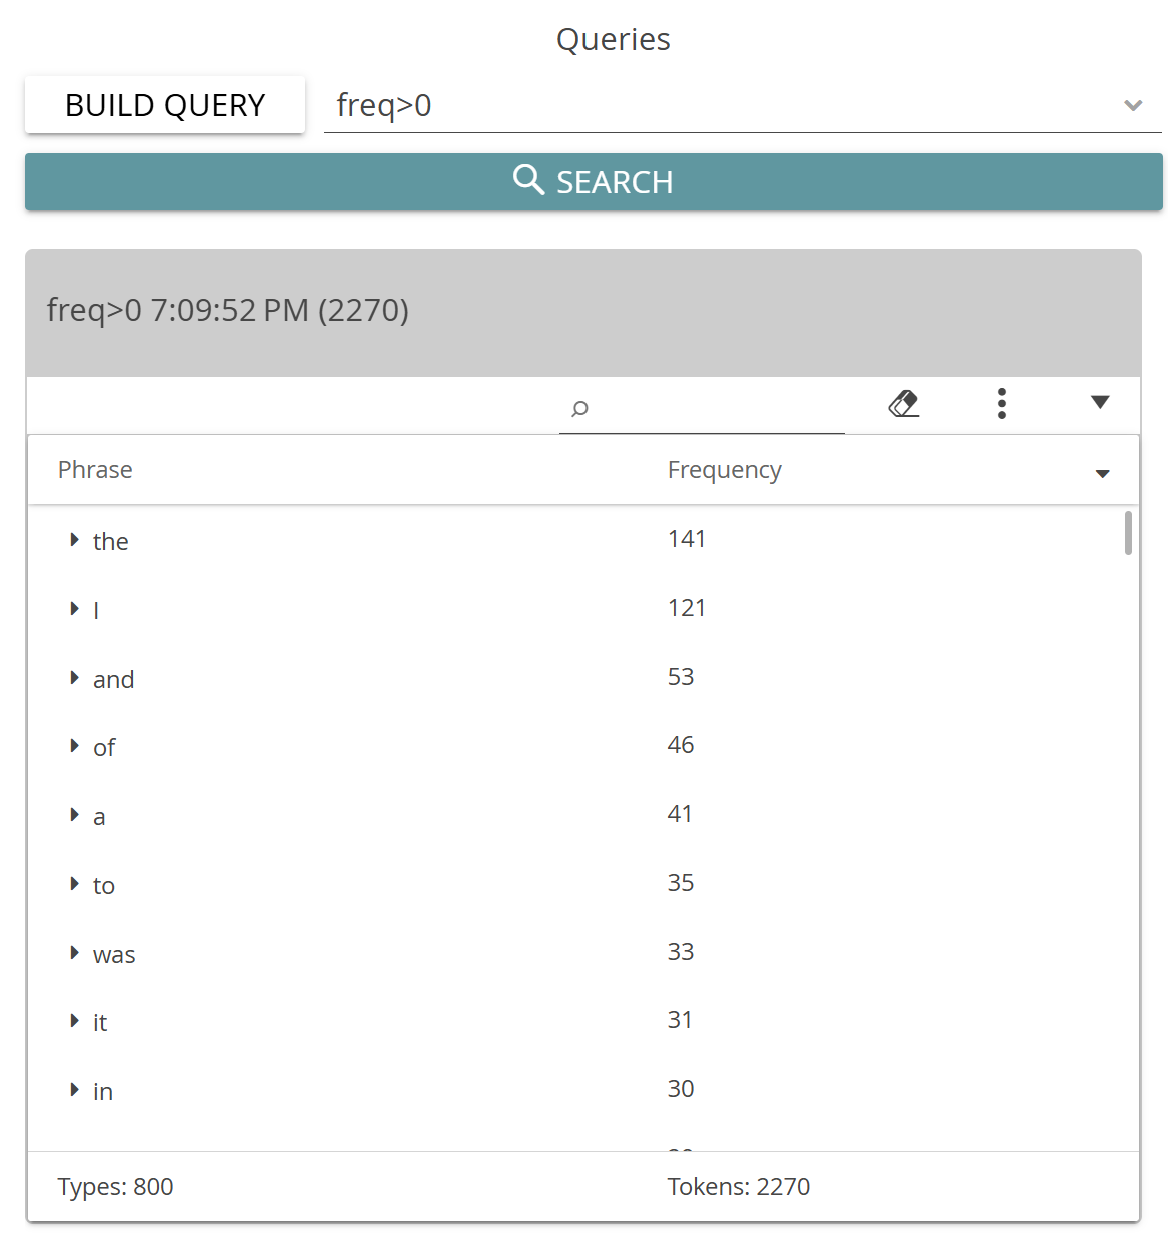
Note how the predefined queries in the drop-down menu each have a name, as listed above, followed by a string of characters in brackets. This string is the actual query statement. When you select one of the options, only the query statement ends up in the query field. The names merely describe the predefined queries and have no meaning in CATMA’s query language. For example, the “Wordlist” query is actually the statement “freq>0”, which is an instruction to fetch all words that occur more than zero times in the analyzed document(s).
You will also notice that, apart from “Wordlist”, all queries use a “%” character in their query statements. This is a so-called “wildcard” character – it is a placeholder that means “anything”. For example, the “Wildcard ‘a’” query is actually the statement “wild = “a%””, which is an instruction to fetch all words that start with the letter “a” followed by any other letters.
After you have selected one of the options, you can directly modify the query statement in the query field to suit your needs. For example, you could change “freq>0” to “freq<5” to search for all words occurring less than five times, and so on.
Query Builder
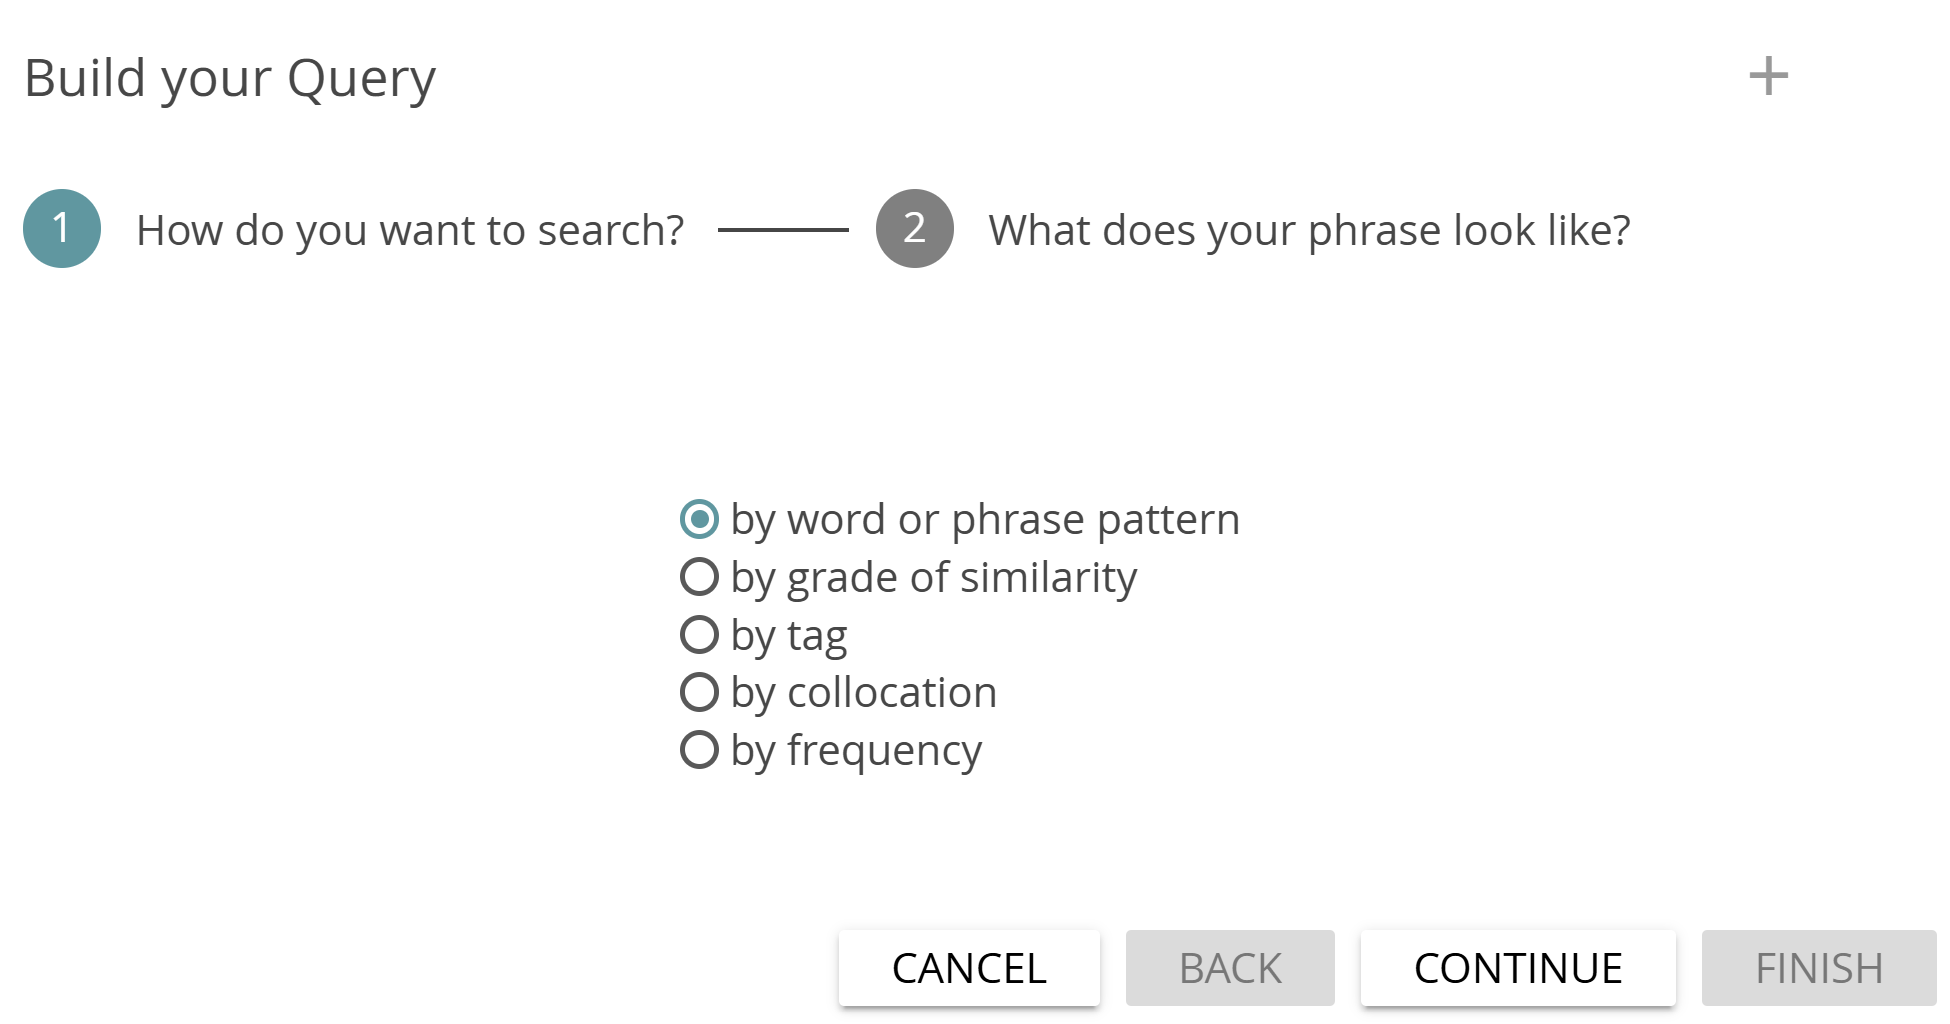
Once you are familiar with the basic predefined queries like “Wordlist” and “Wildcard”, you will soon want to build more complex queries. One way to do this is by using the Query Builder. To get started, click on the “Build Query” button to the left of the query field. A wizard interface will now guide you through the steps to build your query.
The five basic options available here are to search by word or phrase, by grade of similarity (i.e., find all the words/phrases that are similar to a chosen word to a specified degree), by tag, by collocation (i.e., find all the passages where a chosen word appears within a specified word span near another specified word), or by frequency. Make your choice between the five query options, click “Continue” and then follow the instructions in step 2.
Once you have filled in the required fields or made the required choices in step 2, the query that results from the options that you selected is shown at the bottom of the dialog under “Your query so far:”. The purpose of this is to help you to learn the CATMA query language, so that you can construct more complex queries and enter them directly (see Direct Query below).
Click on “Finish” to execute the query. Alternatively, you have the option to add to, exclude from, or refine results from the query so far by clicking on “Continue”. Excluding means to subtract one set of results from the other, while refining means to restrict the results to those that match the additional criteria that you stipulate.
When excluding or refining in the context of queries involving annotations (i.e., queries using the “tag” or “property” keywords), you can specify a “match mode” to control how annotations are matched with other annotations or phrases. There are three match modes:
- exact (the default) – the annotations on one side of the query must apply to exactly the same section of text as the annotations or phrases on the other side
- boundary – the annotations on one side of the query must completely contain the annotations or phrases on the other side
- overlap – the annotations on one side of the query must overlap with the annotations or phrases on the other side at least partially
Direct Query
The third option for queries is to type them directly into the query field and then execute them by clicking on “Search” or hitting the ENTER key on your keyboard.
A summary of the query language including all available options and examples can be found under Query Language.
Explore Query Results
Once a query has been executed, you can explore your results. Each time you execute a query, the results are displayed in a panel beneath the query field, titled with the query itself, a timestamp and the total number of results.
If you execute several queries, new result panels will be added and stacked on top of existing ones. The panels can be collapsed by clicking the larger arrow at the top right. Click on the eraser icon to get rid of query results.
Within each result panel, you will find a table listing the results of the corresponding query. The default order in which the results are displayed is by descending frequency. Click on the column headings to change the sort order.
The results are grouped according to phrase by default, meaning that there is one table row per unique phrase. You can drill down into individual results by clicking the little arrows in front of an entry. You will first see the document(s) in which the result occurs, followed by individual occurrences if you drill down further. Each individual occurrence is displayed in its context in the text, i.e., with a limited number of words that appear before and after.
To adjust the grouping of the results (for example by tag), use the three-dot menu. Here you will also find options to edit the context size, to turn the filtering of punctuation marks on or off, as well as different export options. Lastly, you can filter results by using the provided search box.
Visualize
Generate Visualizations
Visualizing text and/or annotations may help you to present your analysis results or to explore them further. Query results can be fed into four different types of visualization: The KWIC (KeyWord In Context) visualization, the Distribution graph, the Wordcloud and the Doubletree (network) visualization.
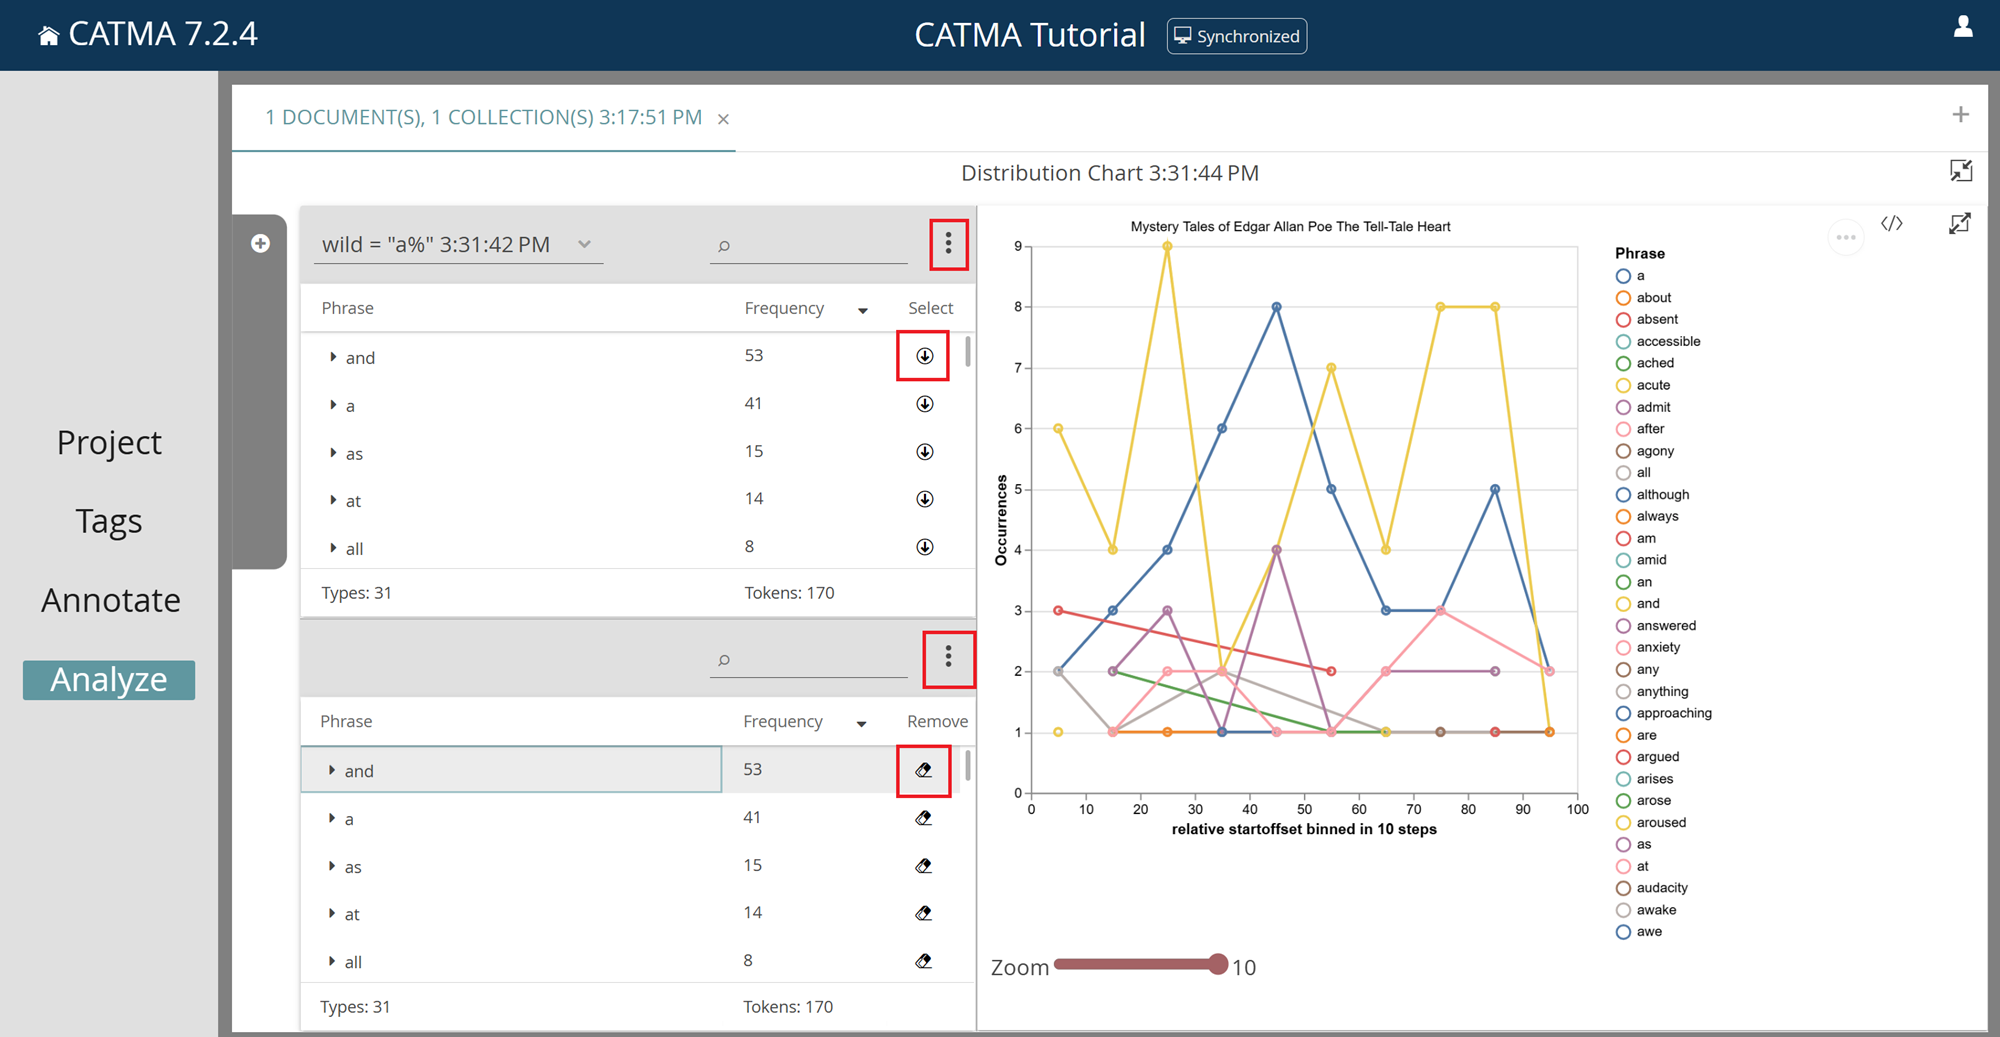
To generate a visualization, you first need some query results, as described in the previous section. Next click on one of the icons on the right of the Analyze module to choose the type of visualization. You will notice that the view of the Analyze module changes. Even though nothing is being shown yet, you are now “inside” of a visualization. The left-hand column is still for queries and their results, while the actual visualization will be displayed in the right-hand column. Most importantly, the left-hand column now consists of two panels. In the top one you can see the results of the queries you ran previously, and you can switch between different result sets using the drop-down list in the top-left corner of the panel. The bottom panel contains those query results that you have selected for the visualization.
You can now decide which of your query results should be fed into the visualization. Make your choice by clicking on the circled arrow icon in the Select column of individual query results, or select all results from the set by using the three-dot menu in the top-right corner of the results panel.
Once selected, results are also displayed in the selected results panel below and integrated into the visualization. To remove them from both, click on the eraser icon in the Remove column of selected results, or remove all selected results by using the three-dot menu of the bottom panel.
To minimize the currently open visualization and return to the “normal” view of the Analyze module, where you can run new queries, click on the icon with the two arrows pointing inwards in the upper-right corner.
Similar to the queries on the left, previously opened visualizations are stacked in panels on the right and can be reopened by clicking on the icon with the two arrows pointing outwards in the bottom-right corner of each panel. Click on the eraser icon to get rid of visualizations.
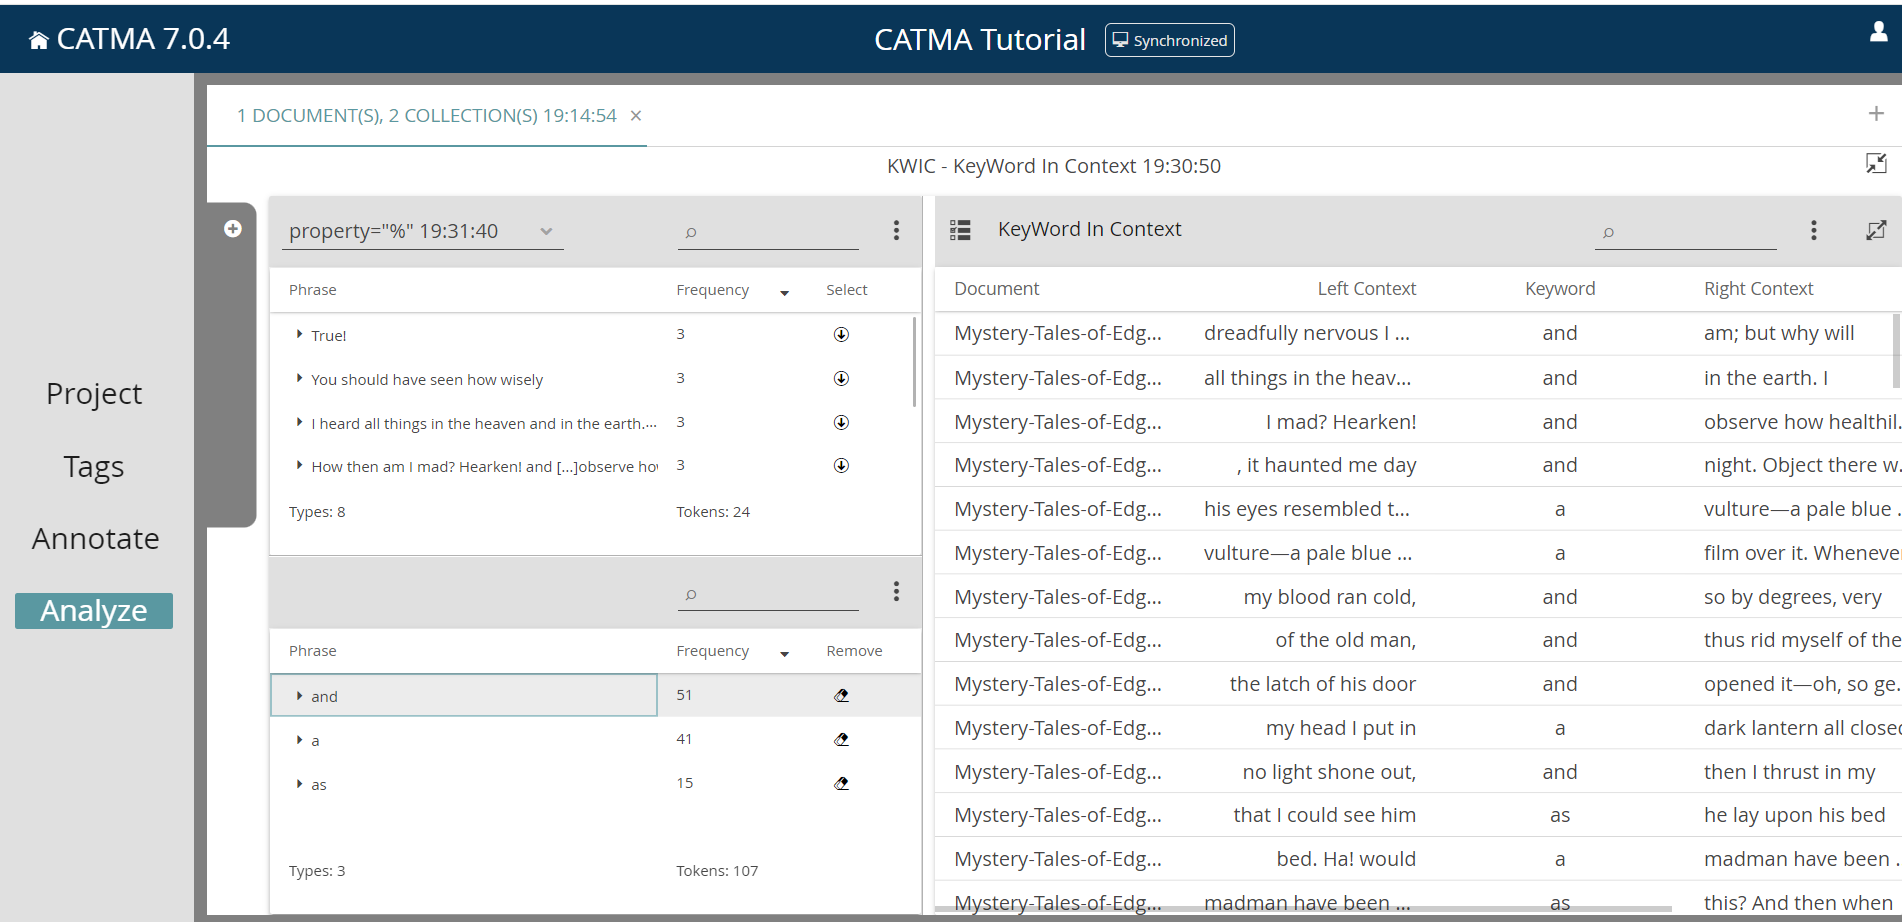
KWIC Visualization
The KWIC (KeyWord In Context) visualization shows you results in their textual contexts in the form of a table. You can change the context size or export the table by using its three-dot menu, and you can change the sort order by clicking on the column headings. To the right of the column headings you will find a burger menu, allowing you to show or hide specific columns.
You can also use the KWIC visualization to create annotations semi-automatically! For example, you could run a query to find all occurrences of a particular named character and annotate these in one go. To begin, switch on the tickable checkboxes using the icon in the top-left corner of the table. Select one or more rows, then choose “Annotate Selected Rows” from the three-dot menu and follow the instructions. For the results of queries involving annotations (i.e., queries using the “tag” or “property” keywords), you also have the option of editing or deleting them in bulk.
By double-clicking a line in the KWIC table, you can also jump to the relevant text passage in the document in the Annotate module. This is then underlined with a red and yellow bar in the text. To avoid having to constantly switch between Analyze and Annotate, the KWIC table is also shown in the Annotate module.
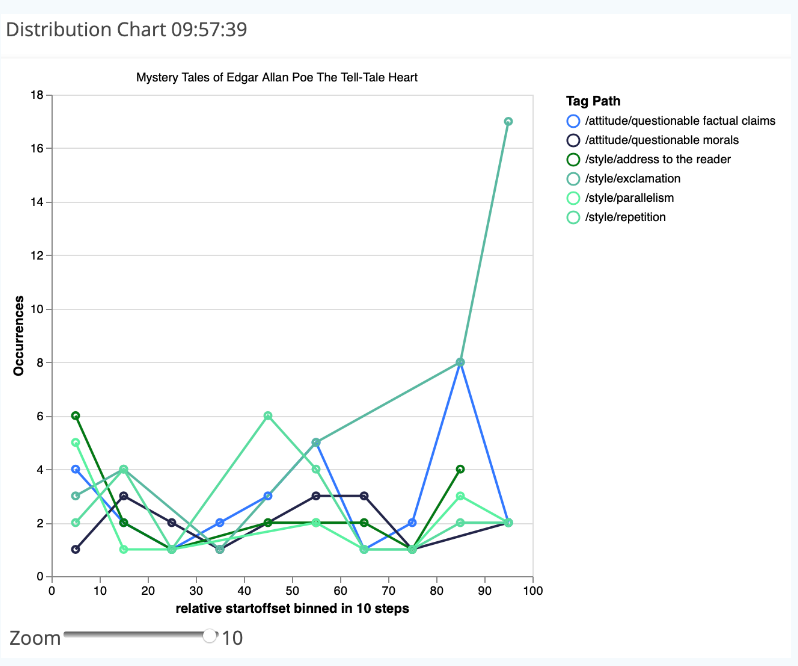
Distribution Visualization
The distribution graph displays the distribution of query results across texts – the results are accumulated per 10 percent of the document length and summarized in a data dot. If you click on a data dot in the distribution graph, you will see a KWIC view for this data below the graph(s). From there, you can again jump into the text via double-click or choose an option from the three-dot menu.
You can save the distribution graph visualization as SVG or PNG via the horizontal three-dot menu on the right.
If you want to tweak your visualization in Vega Online Editor, click the code icon (</>) on the right and tick the box “Expose the selected data for access in the Vega Online Editor”. Collapse the sidebar by clicking on the double arrow and select “Open in Vega Editor” from the horizontal three-dot menu.
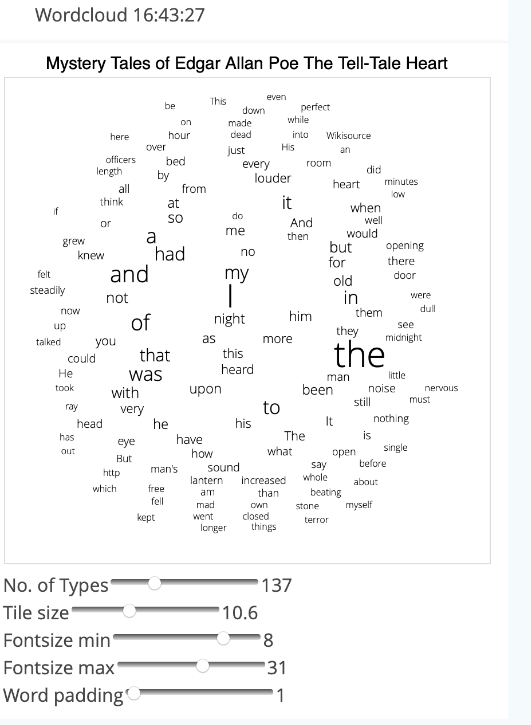
Wordcloud Visualization
The wordcloud shows you an overview of the frequency of your query results. The higher the frequency of a word in a document, the larger it appears in the cloud. If you click on a word in the wordcloud, you will see a KWIC view for this data below the cloud(s). From there, you can again jump into the text via double-click or choose an option from the three-dot menu.
You can save the wordcloud visualization as SVG or PNG via the horizontal three-dot menu on the right.
If you want to tweak your visualization in Vega Online Editor, click the code icon (</>) on the right and tick the box “Expose the selected data for access in the Vega Online Editor”. Collapse the sidebar clicking on the double arrow and select “Open in Vega Editor” from the horizontal three-dot menu.
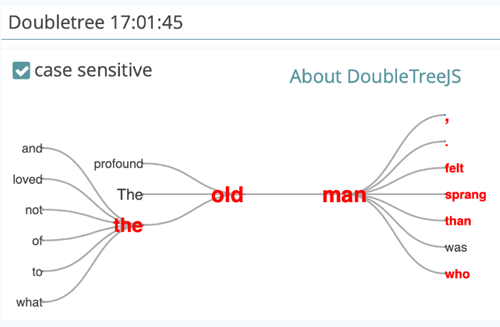
DoubleTree (Network) Visualization
The DoubleTree displays KWIC (KeyWord In Context) results as a browsable tree, showing both the preceding and following contexts of one particular word. By clicking on words to the left or right side of the central word, you will begin to explore the preceding and following contexts, respectively .
As you expand the individual branches of the tree further, you will start to see how chains of words connect to the central word to form sentences. You can pan the visualization by keeping the left mouse button clicked and dragging. If you have selected more than one word for the visualization, you can switch between them by clicking on the relevant row in the selected results panel at the bottom left.
As the DoubleTree visualization is implemented differently than the Distribution or Wordcloud visualizations, there is no menu option to save it as an image, but you can always take a screenshot.